polakowo/vectorbt: Vectorized Backtesting at Scale
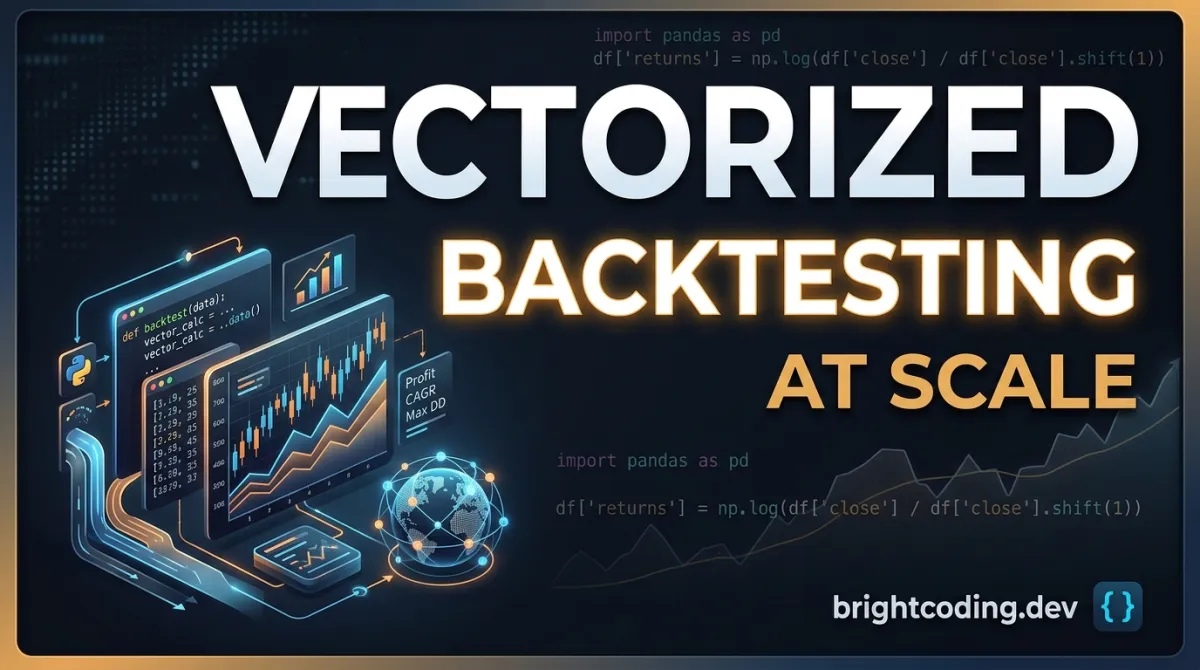
polakowo/vectorbt: Vectorized Backtesting at Scale
Backtesting trading strategies is traditionally slow. Most frameworks iterate bar-by-bar, strategy-by-strategy — a pattern that collapses under the weight of parameter sweeps or multi-asset analysis. For developers and quantitative researchers who need to explore thousands of configurations, this sequential approach becomes a bottleneck that turns hours of grid search into an overnight job. polakowo/vectorbt addresses this directly by rethinking the computation model: pack configurations into matrices, accelerate with compiled code, and evaluate everything at once. With 8,335 GitHub stars and active maintenance through mid-2026, it has become a reference implementation for vectorized financial backtesting in Python↗ Bright Coding Blog.
What is polakowo/vectorbt?
polakowo/vectorbt is an open-source Python backtesting engine maintained by Oleg Polakow. It sits at the intersection of quantitative finance, high-performance computing, and data science tooling — built on pandas and NumPy, with optional acceleration through Numba JIT compilation and a precompiled Rust engine.
The project's core thesis is that backtesting should be expressed as array operations rather than imperative loops. This isn't merely an optimization: it changes what kinds of questions researchers can ask. Instead of testing one strategy variant, you can test ten thousand; instead of one asset, you can analyze cross-asset signals simultaneously. The library exposes this through a pandas-native API with custom accessors, making the vectorized approach feel familiar rather than alien.
The repository carries an "Other" license — specifically Apache 2.0 with Commons Clause, a fair-code arrangement that permits free use by individuals and organizations but restricts selling products or services primarily based on this software. The PRO edition at vectorbt.pro offers additional commercial features, while the GitHub-hosted version represents the open-source community edition.
With 1,079 forks and sustained commit activity, the project demonstrates both adoption and ongoing refinement. The presence of Docker↗ Bright Coding Blog images, GitHub Actions CI, and PyPI distribution indicates production-grade packaging rather than experimental code.
Key Features
Matrix-native execution model. The fundamental architectural decision is representing strategy parameters and price data as multidimensional arrays. Operations broadcast across configurations without explicit Python loops, leveraging NumPy's optimized C implementations.
Accelerated computation paths. Hot paths compile through Numba for JIT speedups. For scenarios where JIT overhead matters or maximum performance is required, an optional Rust engine (vectorbt-rust) provides precompiled acceleration.
Flexible broadcasting system. Multi-asset analysis and parameter sweeps integrate naturally. The library handles alignment of different time series, missing data, and varying parameter combinations through its broadcasting layer.
Rich indicator ecosystem. Custom indicators coexist with integrations for established libraries: TA-Lib, Pandas TA, and others. This reduces friction for researchers with existing indicator codebases.
Portfolio-level analytics. Beyond signal generation, the library computes trade-level statistics, drawdown analysis, and performance metrics including Sharpe ratio, Calmar ratio, Sortino ratio, and Omega ratio. QuantStats integration provides additional reporting depth.
Signal tooling. Generation, ranking, mapping, and distribution analysis utilities support strategy development and ML feature engineering workflows.
Built-in data access. Yahoo Finance downloading, preprocessing utilities, and synthetic data generation reduce external dependencies for prototyping.
Robustness testing infrastructure. Walk-forward optimization and label generation support systematic validation and machine learning pipelines.
Interactive visualization. Plotly-based charts, Jupyter widgets, and browser-friendly dashboards enable exploratory analysis without leaving the notebook environment.
Automation support. Scheduled updates and Telegram notification tools allow deployment of monitoring systems.
Use Cases
Systematic strategy research. A quantitative researcher testing momentum signals across fifty assets with twenty parameter combinations each faces one thousand backtests. polakowo/vectorbt's vectorized approach evaluates these simultaneously rather than sequentially, compressing what might be hours into seconds.
ML-driven strategy generation. The signal tooling and label generation support feature engineering for supervised learning approaches. Researchers can generate candidate signals, create target labels, and validate predictive power through the same framework used for final backtesting — reducing pipeline fragmentation.
Cross-asset regime analysis. The broadcasting system naturally handles portfolios of cryptocurrencies, equities, or mixed asset classes. The heatmap visualization example in the documentation demonstrates identifying which SMA window combinations perform across BTC, ETH, and XRP — a pattern extensible to traditional markets.
Rapid hypothesis validation. Before committing to full implementation, traders can express ideas in few lines of pandas-style code and immediately see performance metrics. The Portfolio.from_holding one-liner for buy-and-hold comparison establishes baseline expectations against which active strategies compete.
Production monitoring. Automation tools and Telegram integration allow transitioning from research to live monitoring, though the disclaimer emphasizes educational use and risk awareness.
Installation & Setup
Base installation via pip:
pip install -U vectorbt
This installs the core library with NumPy, pandas, and Numba dependencies.
For the optional Rust engine:
pip install -U "vectorbt[rust]"
The Rust engine eliminates JIT compilation overhead for repeated executions, beneficial in production or heavily iterative workflows.
For all optional integrations including TA-Lib and Pandas TA:
pip install -U "vectorbt[full]"
Combined Rust engine and full integrations:
pip install -U "vectorbt[full,rust]"
Docker images are available at polakowo/vectorbt on Docker Hub for containerized deployments. The project supports Python versions indicated by its PyPI classifiers (consult the badge on the repository for current specifics).
For Google Colab users, a prepared notebook provides immediate execution environment without local installation.
Real Code Examples
The following examples reproduce documented patterns from the repository. They demonstrate the library's progression from simple holding analysis through parameter sweeps.
Baseline: Buy-and-Hold Performance
import vectorbt as vbt

# Download BTC-USD daily data from Yahoo Finance
data = vbt.YFData.download("BTC-USD")
price = data.get("Close")

# Simulate $100 invested at the first available price
pf = vbt.Portfolio.from_holding(price, init_cash=100)
print(pf.total_profit())
This establishes reference performance: approximately $19,501 profit from a $100 BTC investment since 2014. All subsequent strategies compete against this baseline.
Dual-SMA Crossover Strategy
# Compute fast and slow moving averages
fast_ma = vbt.MA.run(price, 10)
slow_ma = vbt.MA.run(price, 50)

# Generate entry/exit signals from crossovers
entries = fast_ma.ma_crossed_above(slow_ma)
exits = fast_ma.ma_crossed_below(slow_ma)

# Backtest with $100 initial capital
pf = vbt.Portfolio.from_signals(price, entries, exits, init_cash=100)
print(pf.total_profit())
The SMA crossover yields approximately $34,418 — outperforming buy-and-hold in this specific configuration, though this single result requires broader validation.
Large-Scale Parameter Sweep
import numpy as np

# Multiple assets
symbols = ["BTC-USD", "ETH-USD", "XRP-USD"]
data = vbt.YFData.download(symbols, missing_index="drop")
price = data.get("Close")

# All window pairs from 2 to 100
windows = np.arange(2, 101)
fast_ma, slow_ma = vbt.MA.run_combs(
    price, window=windows, r=2,
    short_names=["fast", "slow"]
)

entries = fast_ma.ma_crossed_above(slow_ma)
exits = fast_ma.ma_crossed_below(slow_ma)

# Execute 4,950 combinations per asset simultaneously
pf = vbt.Portfolio.from_signals(
    price, entries, exits,
    size=np.inf, fees=0.001, freq="1D"
)

# Visualize as interactive heatmap
fig = pf.total_return().vbt.heatmap(
    x_level="fast_window", y_level="slow_window",
    slider_level="symbol", symmetric=True,
    trace_kwargs=dict(colorbar=dict(
        title="Total return", tickformat="%"
    ))
)
fig.show()
This demonstrates the library's distinctive capability: nearly five thousand strategy variants evaluated in a single call, with interactive visualization revealing which parameter combinations work for which assets.
Strategy Inspection
# Access any specific configuration's full statistics
print(pf[(10, 20, "ETH-USD")].stats())
Output includes 25 metrics from total return to average trade duration, enabling granular comparison across the parameter space.
Advanced Usage & Best Practices
Start with from_holding baselines. Every active strategy should be evaluated against its passive equivalent. The library makes this trivial — skipping this step leads to overestimating alpha.
Use run_combs for systematic exploration. Manual parameter grids miss interactions. The combination runner ensures coverage and returns properly labeled results for analysis.
Consider Rust engine for repeated execution. JIT compilation amortizes across large arrays but adds overhead for small or single runs. The Rust engine removes this variable.
Leverage missing_index="drop" carefully. Multi-asset analysis requires aligned time series; dropping misaligned periods is conservative but may introduce survivorship bias. Understand your data before defaulting to this.
Inspect stats() before plot(). Visual appeal can obscure poor risk-adjusted returns. The metrics table reveals drawdown duration, win rate, and expectancy that charts compress.
Comparison with Alternatives
| Dimension | polakowo/vectorbt | Backtrader | Zipline |
|---|---|---|---|
| Execution model | Vectorized (matrix) | Event-driven (loop) | Event-driven (loop) |
| Scale | Thousands of configs | Single config | Single config |
| Speed | NumPy/Numba/Rust | Pure Python | C with Python API |
| API style | Pandas-native | Object-oriented | Pipeline-based |
| Maintenance | Active (2026) | Limited | Quantopian sunset; community forks |
| License | Apache 2.0 + Commons Clause | GPL-3.0 | Apache 2.0 |
Backtrader offers mature broker integration and community knowledge but cannot match vectorized throughput. Zipline's pipeline architecture suits Quantopian's historical model but requires more scaffolding for ad-hoc research. polakowo/vectorbt occupies a distinct niche: researchers prioritizing computational scale over execution realism, particularly in crypto and multi-asset contexts.
FAQ
Is polakowo/vectorbt free for commercial use? The source is publicly available and free to use, but the Commons Clause prohibits selling products or services primarily based on this software. Contact the author for exceptions.
Does it require GPU acceleration? No. Performance comes from CPU-based vectorization (NumPy), JIT compilation (Numba), and optional Rust — not GPU computing.
Can I backtest options or futures? The README focuses on price-based strategies. Check the documentation for derivatives support specifics.
How does the PRO edition differ? VectorBT PRO at vectorbt.pro offers additional features; the GitHub repository is the open-source community edition.
Is live trading supported? The library is explicitly for backtesting and research. The disclaimer states educational purposes only.
What Python versions work? Consult the PyPI version badge on the repository for currently supported versions.
How do I report issues or contribute? Use GitHub Issues and Pull Requests at the repository. The test suite runs via GitHub Actions.
Conclusion
polakowo/vectorbt solves a specific, well-defined problem: the computational bottleneck in systematic strategy research. For developers and quantitative analysts who need to explore parameter spaces that would choke event-driven frameworks, its matrix-native approach offers genuine capability differentiation. The 8,335 stars and active maintenance signal community validation, while the fair-code license preserves open access with commercial boundaries.
This is not a tool for traders seeking turnkey broker integration or those uncomfortable with pandas-level abstraction. It is for researchers who think in arrays, value throughput, and need to ask "what if" thousands of times before committing capital.
Explore the codebase, run the Colab notebook, or install locally to evaluate fit for your workflow: https://github.com/polakowo/vectorbt
Explore on the BrightCoding network
Hand-picked resources from our other sites.
Stop Sending Your Data to AI Giants! IronClaw Changes Everything
IronClaw is a privacy-first Agent OS with WASM sandboxing, local encryption, and multi-channel AI assistance. Learn installation, security architecture, and why...
Cut LLM API Costs by 80%: The RTK CLI Proxy Secret
RTK is a Rust CLI proxy that reduces LLM token consumption by 60-90% on common dev commands. Single binary, zero dependencies, sub-10ms overhead. Install via Ho...
anombyte93/prd-taskmaster: Zero-Config PRD-to-Code Engine for Claude Code
anombyte93/prd-taskmaster is a pre-alpha, MIT-licensed Python engine for Claude Code that transforms one-line goals into graded PRDs, dependency-ordered task gr...
Continuez votre lecture

CyberScraper-2077: Open-Source AI Tool to Scrape Any Website in 2026

Zasper: The Revolutionary IDE That Handles 40X More Notebooks
tsfresh: The Powerful Python Tool Automating Time Series Features

Stop Coding Alone: OPC-Skills Gives Your AI Agent Superpowers
Commentaires 0
Aucun commentaire pour l'instant. Soyez le premier à réagir !