Stop Drawing Flowcharts by Hand! Use Flowchart Fun Instead
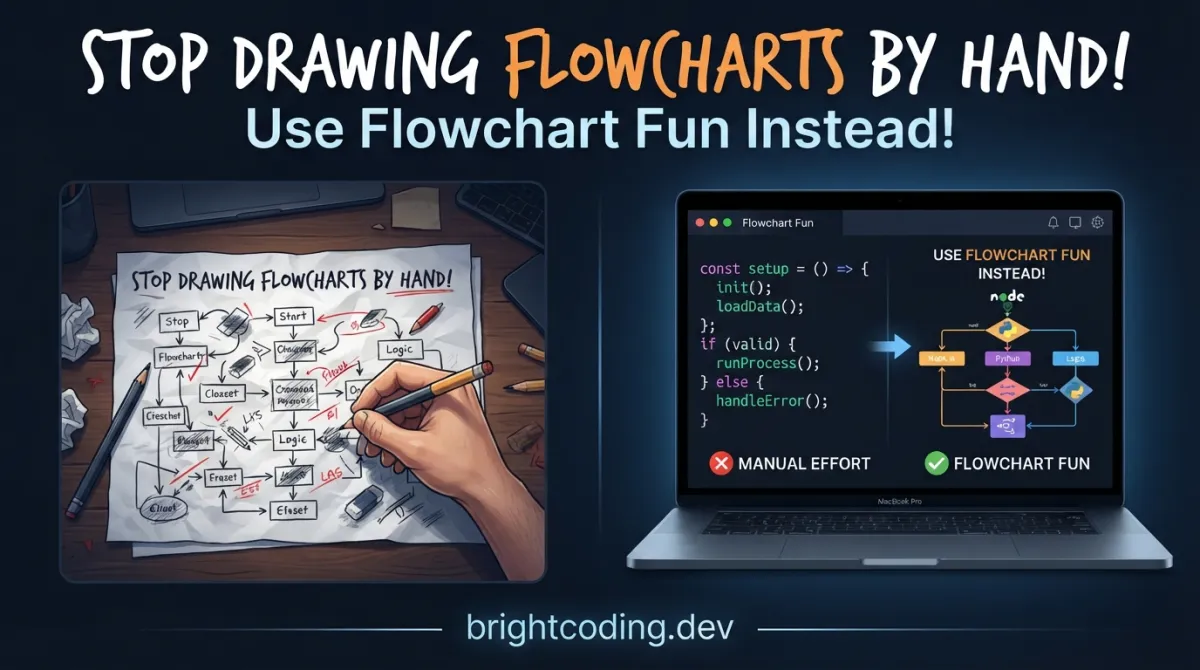
Let me ask you something that might sting a little: How many hours did you waste last month dragging boxes around in Lucidchart? Be honest. You needed to map out that API architecture, document a user flow, or explain a state machine to your team. And there you were, fighting with snap-to-grid, wrestling with connector lines, and screaming at your mouse because the arrow refused to bend the right way.
Here's the dirty secret the diagramming industry doesn't want you to know: visual thinking shouldn't require visual labor. Your brain already structured the logic. You already knew Node A connects to Node B. Why are you still paying $15/month for the privilege of manual pixel-pushing?
What if I told you there's a tool where you simply type your flowchart — in plain text — and watch it materialize before your eyes? No clicking. No dragging. No subscription ransom. Just pure, effortless flowchart generation that feels like magic but runs on rock-solid technology.
Welcome to Flowchart Fun — the open-source webapp that's making traditional diagramming tools look like relics from 2008. Built by the brilliant team at Tone Row, this isn't just another "me too" diagramming tool. It's a paradigm shift in how developers, product managers, and technical writers create visual documentation. And it's completely free.
In this deep dive, I'll expose exactly how Flowchart Fun works under the hood, why top developers are quietly migrating from expensive alternatives, and how you can start generating production-ready diagrams in under 60 seconds. The days of diagramming frustration? They're about to end.
What Is Flowchart Fun?
Flowchart Fun is an open-source web application that transforms plain text into interactive, exportable flowcharts and diagrams through an intuitive indentation-based syntax. Created by Tone Row, a creative technology studio focused on building elegant developer tools, Flowchart Fun represents a fundamental reimagining of how we create visual documentation.
The project lives at github.com/tone-row/flowchart-fun and has been gaining serious traction among developers who are tired of the friction inherent in traditional diagramming workflows. At its core, Flowchart Fun is built on two powerhouse technologies: React↗ Bright Coding Blog for the responsive, modern interface, and Cytoscape.js — the same battle-tested graph theory library used by organizations like Amazon, Google, and the NIH for complex network visualizations.
But why is this tool trending now? The answer lies in a perfect storm of developer needs:
- The rise of "docs-as-code" means developers want everything in version control — including diagrams
- Remote work demands faster, more shareable visual communication
- API-first development requires constant architectural documentation that traditional tools can't keep pace with
- The open-source movement has matured to expect premium experiences without premium price tags
Flowchart Fun hits every one of these pain points. Unlike proprietary tools that lock your diagrams behind paywalls, Flowchart Fun generates diagrams from plain text that you can store in Git, diff in pull requests, and generate programmatically. It's diagramming that finally respects how modern developers actually work.
The project also offers premium features for teams needing authentication, persistent storage, and collaboration — but the core text-to-diagram engine? Completely free and self-hostable. That's a value proposition that expensive alternatives simply cannot match.
Key Features That Make Flowchart Fun Irresistible
Let's dissect what makes this tool genuinely special, feature by feature:
🚀 Instant Text-to-Diagram Conversion The magic happens through an elegant indentation syntax. No XML. No JSON schemas. No proprietary file formats. Just natural language structure that mirrors how you already think about relationships. Type it, see it. The parser — powered by Tone Row's custom Graph Selector library — handles the heavy lifting.
⚡ Lightning-Fast Iteration Cycles Because your diagram is text, you can refactor entire architectures by copying, pasting, and indenting. Need to insert a new decision point? Just add a line. Want to rewire connections? Change a label. The feedback loop is instantaneous, eliminating the cognitive disconnect between thinking and visualizing.
🎨 Interactive Cytoscape.js Rendering Don't let the simplicity fool you. Under the hood, you're getting production-grade graph visualization. Pan, zoom, select nodes, explore layouts — all the interactivity you'd expect from enterprise tools, powered by a library trusted in scientific research and commercial applications worldwide.
🔄 Version-Control Friendly
This is the killer feature for engineering teams. Your diagrams become .txt files that diff cleanly in Git. Code review your architecture changes. Revert to previous diagram states. Generate diagrams from CI/CD pipelines. It's diagramming that finally integrates with your existing workflow instead of fighting it.
🌍 Internationalization Support
Flowchart Fun actively welcomes translations through .po files in /app/src/locales/[language]/messages.po. Run pnpm -F app compile after adding translations. This isn't a tool built exclusively for English-speaking developers — it's designed for global adoption.
🧪 Comprehensive Testing Infrastructure Quality isn't an afterthought. The project employs Jest for unit testing and Playwright for end-to-end browser automation. This isn't hobbyist code; it's professional-grade software engineering that you can bet your documentation pipeline on.
📦 Self-Hostable and Hackable Want to run it behind your firewall? Need custom styling for your brand? The entire stack is yours to modify. The React-based architecture means any frontend developer can extend it. The Graph Selector parser is separately maintained for specialized use cases.
Real-World Use Cases Where Flowchart Fun Dominates
Still wondering if this fits your workflow? Here are four concrete scenarios where Flowchart Fun doesn't just compete — it crushes traditional alternatives:
1. API Architecture Documentation
You're designing a microservices architecture with 15 services, event buses, and circuit breakers. In Draw.io, this becomes an unmaintainable spaghetti monster. In Flowchart Fun, you write:
API Gateway
  routes to: Auth Service
    validates via: JWT Provider
  routes to: Order Service
    publishes to: Event Bus
      consumed by: Inventory Service
      consumed by: Notification Service
Your entire architecture, version-controlled, reviewable, and instantly updatable when services change. Game over for drag-and-drop tools.
2. Interview Preparation and System Design
Preparing for that FAANG system design round? Flowchart Fun lets you rapidly sketch and iterate on designs while verbalizing your thought process. The text format means you can practice by typing — no fumbling with a mouse while the interviewer watches. Export your final diagram as a PNG for your notes.
3. CI/CD Pipeline Visualization
DevOps↗ Bright Coding Blog engineers need to document complex deployment flows. Instead of maintaining separate diagrams that drift from reality, embed Flowchart Fun generation into your pipeline. Generate current-state diagrams from your actual Kubernetes manifests or Terraform configurations.
4. Onboarding and Runbook Documentation
New engineer joining your team? Instead of static screenshots that become outdated, give them living documentation. The text format means anyone can update it without learning a new tool. Your runbooks stay current because updating them is as easy as editing a text file.
Step-by-Step Installation & Setup Guide
Ready to escape diagramming hell? Here's your complete setup path, whether you want the full experience or just the core engine:
Prerequisites
For basic development, you'll need:
- Node.js (v16 or later recommended)
- pnpm package manager
- Git
For premium features (authentication, payments, cloud storage), you'll additionally need accounts on:
- Vercel — serverless deployment
- Supabase — PostgreSQL↗ Bright Coding Blog backend
- Stripe — payment processing
- Sendgrid — transactional email
Basic Setup (No Login Required)
This gets you the core diagramming engine running locally in under 5 minutes:
# Clone the repository
git clone https://github.com/tone-row/flowchart-fun.git
cd flowchart-fun

# Install dependencies — pnpm is required
pnpm install

# Start the development server without authentication
pnpm dev
Your browser will open to localhost:3000 with full diagramming capabilities. No cloud accounts needed.
Full Setup (With Login Features)
For the complete experience including user accounts and cloud saves:
# Copy environment template and fill in your credentials
cp .env.example .env
# Edit .env with your Vercel, Supabase, Stripe, and Sendgrid credentials

# Install Vercel CLI globally if you haven't
npm i -g vercel

# Login and deploy locally
vercel login
vercel dev
Critical note: Production deployment requires a Pro Vercel account because the application uses more than 12 serverless functions. The free tier won't cut it for full deployment, though local development works perfectly.
Translation Development
Want to contribute a new language? The process is beautifully straightforward:
# Add translations to the appropriate locale file
# e.g., /app/src/locales/de/messages.po for German

# Compile the translation files
pnpm -F app compile
Join their Discord to coordinate with the maintainers before starting major translation work.
Testing Your Installation
Verify everything works with the test suites:
# Run unit tests with Jest
pnpm -F app test

# Run end-to-end tests with Playwright
pnpm -F app e2e
Bundle Analysis
Optimizing for production? Analyze your build:
pnpm -F app build && pnpm -F app analyze
REAL Code Examples from the Repository
Let's examine actual code patterns from Flowchart Fun's implementation and documentation. These aren't contrived examples — they're the real syntax and commands that power this tool.
Example 1: The Core Text Syntax
This is the fundamental pattern from the repository's README. Study it carefully — this is where the magic lives:
Node A
  goes to: Node B
  and: Node C
    goes back to: (Node A)
What's happening here? This indentation-based syntax uses two simple rules:
- Indentation creates hierarchy:
Node BandNode Care children ofNode A - Colons define relationships: The text before
:becomes the edge label, the text after becomes the target node - Parentheses create references:
(Node A)refers back to an existing node, creating cycles without duplication
The parser — Tone Row's custom Graph Selector — transforms this into a directed graph structure that Cytoscape.js renders. The indentation can be spaces or tabs; consistency within a document is what matters.
Example 2: Development Commands
These are the exact commands from the repository for local development:
# Clone and enter the repository
git clone https://github.com/tone-row/flowchart-fun.git
cd flowchart-fun

# Copy environment configuration template
cp .env.example .env
# ⬆️ You MUST edit .env with your actual API keys for full features

# Install all dependencies using pnpm (not npm!)
pnpm install

# Development mode WITHOUT authentication features
pnpm dev

# Development mode WITH authentication (requires Vercel CLI)
vercel dev
Critical implementation detail: Notice the dual-path development setup. The pnpm dev command bypasses all serverless functions, running purely as a React application. This is perfect for frontend contributions or when you're only working on the diagramming engine. The vercel dev command spins up the full serverless environment, necessary for testing login flows, payment integration, or database operations.
Example 3: Testing and Quality Assurance
The repository's testing infrastructure reveals professional-grade development practices:
# Unit testing with Jest — fast feedback for logic changes
pnpm -F app test

# End-to-end testing with Playwright — full browser automation
pnpm -F app e2e

# Production build with bundle analysis
pnpm -F app build && pnpm -F app analyze
Why this matters: The -F app flag is pnpm's workspace filter, targeting specifically the app package within this monorepo structure. This suggests Flowchart Fun likely organizes related packages (the parser, shared components, etc.) in a unified workspace. The Playwright e2e tests are particularly valuable — they verify that your text-to-diagram conversion actually renders correctly across browsers, catching visual regressions that unit tests would miss.
Example 4: Translation Workflow
For internationalization contributors, the exact workflow is:
# 1. Locate or create translation files
# Path pattern: /app/src/locales/[language-code]/messages.po

# 2. Edit .po files with standard gettext format
# Example entry:
# msgid "Create New Flowchart"
# msgstr "Neuen Flussdiagramm erstellen"

# 3. Compile translations into the application
pnpm -F app compile
Technical insight: The .po (Portable Object) format is the industry standard for internationalization, used by GNU gettext. This choice means translators can use familiar tools like Poedit, and the project can leverage established localization platforms. The compile step likely converts these human-readable .po files into optimized JavaScript↗ Bright Coding Blog data structures for runtime efficiency.
Advanced Usage & Best Practices
Ready to go beyond basics? Here are pro strategies from real-world usage:
🎯 Structure for Clarity Use consistent indentation (2 or 4 spaces). Group related nodes under semantic parents. Your text is your documentation — make it readable as text, not just as output.
🔗 Leverage Node References
The (Node Name) syntax prevents duplication. In complex diagrams, define core entities once, reference them everywhere. This creates maintainable diagrams that won't drift out of sync.
📐 Combine with Documentation Generators
Embed Flowchart Fun syntax in Markdown↗ Smart Converter files, then extract and render via CI. Imagine: your API docs automatically include current architecture diagrams generated from checked-in .flow files.
🎨 Customize Through Cytoscape.js Since rendering uses Cytoscape.js, you can tap into its extensive styling API. Fork the repo, modify the Cytoscape configuration, and create branded diagram styles for your organization.
⚡ Cache Generated Diagrams For documentation sites, generate diagrams at build time rather than runtime. The text format makes this trivial — parse once, serve static images.
Comparison with Alternatives
Why should you actually switch? Here's the brutal truth:
| Feature | Flowchart Fun | Lucidchart | Draw.io | Mermaid.js |
|---|---|---|---|---|
| Pricing | Free / Open Source | $7.95+/mo | Free (limited) | Free / Open Source |
| Text-based input | ✅ Native | ❌ No | ❌ No | ✅ Native |
| Real-time preview | ✅ Yes | ✅ Yes | ✅ Yes | ❌ Usually compiled |
| Version control friendly | ✅ Plain text | ❌ Binary/XML | ❌ XML | ✅ Plain text |
| Self-hostable | ✅ Full control | ❌ Cloud only | ❌ Limited | ✅ Possible |
| Interactive rendering | ✅ Cytoscape.js | ✅ Proprietary | ✅ Limited | ❌ Static SVG |
| Learning curve | ⭐ Minimal | ⭐⭐ Moderate | ⭐⭐ Moderate | ⭐⭐⭐ Steep |
| Customization | ⭐⭐⭐ Full code access | ⭐⭐ Limited | ⭐⭐ Limited | ⭐⭐⭐ Full code access |
The verdict: Mermaid.js is Flowchart Fun's closest competitor, but requires Markdown embedding and compilation steps. Flowchart Fun offers instant visual feedback with zero build pipeline. For developers who want immediate gratification without sacrificing code-native workflows, this is the sweet spot.
FAQ: Your Burning Questions Answered
Is Flowchart Fun completely free? The core text-to-diagram engine is 100% free and open-source under MIT license. Premium features (cloud storage, team collaboration) require a subscription, but the self-hosted version gives you full functionality.
Can I use this commercially? Absolutely. The MIT license permits commercial use, modification, and distribution. Fork it for your company's internal tools without legal concerns.
How does this compare to Mermaid.js? Both are text-to-diagram tools, but Flowchart Fun prioritizes instant visual feedback through its web interface. Mermaid requires compilation steps and typically renders static output. Choose Flowchart Fun for interactive exploration, Mermaid for embedded documentation.
What file formats can I export? Through Cytoscape.js capabilities, you can export to PNG, JPG, and JSON formats. The native format is plain text — the most future-proof format imaginable.
Is there a desktop application? Currently web-based only, but the React application can run as a Progressive Web App (PWA) for offline usage after initial load.
How do I report bugs or request features? Use GitHub Issues for technical matters, or join the active Discord community for discussions. The maintainers are responsive and welcome contributions.
Can I contribute to the parser? Yes! The underlying Graph Selector is a separate, actively developed project. Parser improvements benefit the entire ecosystem.
Conclusion: Your Diagramming Liberation Starts Now
Here's what we've uncovered: Flowchart Fun isn't merely a tool — it's a philosophical rejection of everything wrong with diagramming software. It recognizes that your ideas already have structure, that text is the native language of developers, and that visual documentation should emerge effortlessly from clear thinking rather than manual labor.
The evidence is overwhelming. The indentation syntax eliminates cognitive overhead. The Cytoscape.js engine delivers production-grade rendering. The open-source model ensures you'll never face vendor lock-in or surprise price hikes. And the active community — visible in their Discord and contribution guidelines — means this tool will keep evolving.
My honest assessment? After years of wrestling with overpriced, underperforming diagramming tools, Flowchart Fun feels like breathing fresh air. It's not perfect — the premium feature dependency on multiple third-party services adds setup complexity, and you'll need that Pro Vercel account for full deployment. But for individual developers, small teams, or anyone embedding diagrams in code repositories? This is the tool I wish I'd discovered years ago.
Your next step is simple: Head to github.com/tone-row/flowchart-fun, star the repository, and try the live demo at flowchart.fun. Type your first diagram. Feel that rush when it appears instantly. Then ask yourself: why did I ever do this the hard way?
The future of diagramming is text. The future is open. The future is Flowchart Fun. Don't get left behind drawing boxes with a mouse like it's 2005.
Found this breakdown valuable? Star the repository, share this article with your diagramming-frustrated colleagues, and join the Discord to shape the future of visual documentation.
Outils recommandés
Explore on the BrightCoding network
Hand-picked resources from our other sites.
Stop Paying for Screen Annotation! DrawPen Is Free and Insane
Discover DrawPen, the free open-source screen annotation tool for macOS, Windows & Linux. Learn installation, keybindings, real code examples, and why developer...
OpenCloudGaming/OpenNOW: Open-Source GeForce NOW Desktop Client
OpenCloudGaming/OpenNOW is an MIT-licensed, community-built GeForce NOW client with 2,131 stars. Features include Electron desktop app, experimental native Rust...
Lakr233/Asspp: Multi-Region App Store Manager for Apple IDs
Lakr233/Asspp is an open-source Swift application for managing multiple Apple IDs across App Store regions. Features include multi-account support, direct IPA d...
Continuez votre lecture

The Ultimate Guide to Self-Hosted Workflow Automation Executors: Take Control of Your Automation Empire

AI Research Assistant: How Real-Time Web Scraping is Revolutionizing Knowledge Work in 2025

🎮 The Ultimate Guide to Open Source JavaScript Games: 100+ Free Games & Dev Tools You Can Use Today

Stop Coding Alone: OPC-Skills Gives Your AI Agent Superpowers
Commentaires 0
Aucun commentaire pour l'instant. Soyez le premier à réagir !