Stop Guessing Your Mac's Performance: mactop Exposes Every Watt
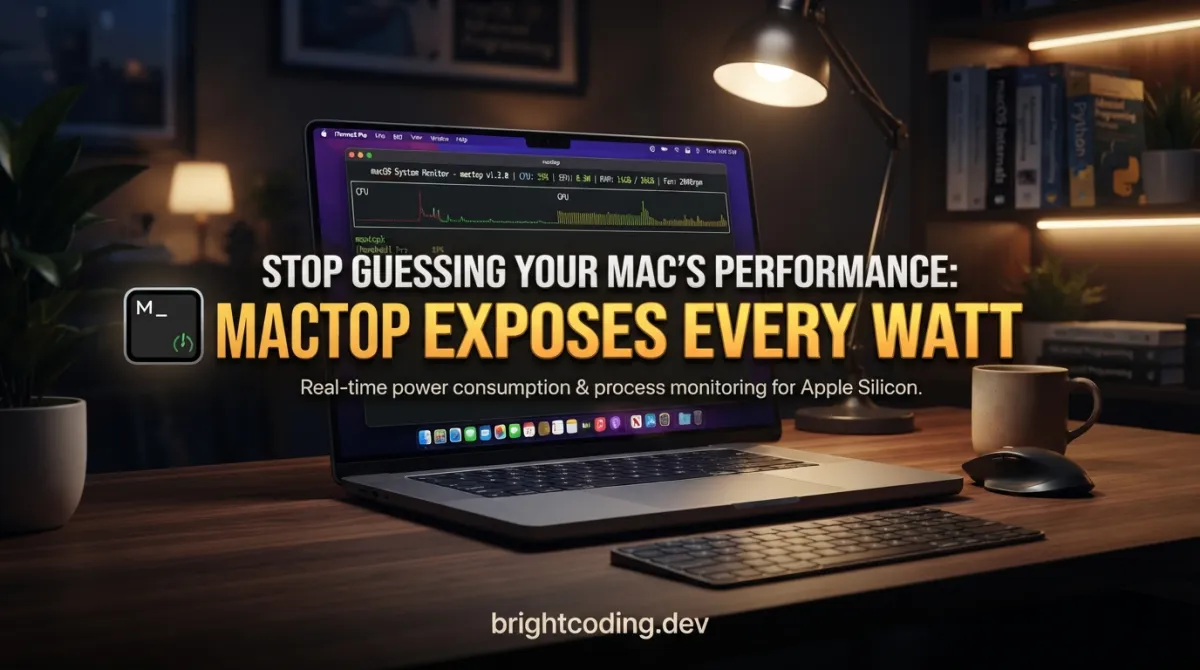
Your MacBook Pro just thermal-throttled during that critical render. Again. You frantically mash Command+Space, type "Activity Monitor," and wait for the spinning beach ball of irony to reveal... almost nothing useful. Which core is actually burning? Is your GPU starving for power? What's the real wattage draw? Apple's built-in tools leave you blind when you need precision most.
Here's the dirty secret Apple won't advertise: Activity Monitor is a toy compared to what your Apple Silicon chip actually reports. Under the hood, your M3 Max or M5 Pro is broadcasting granular metrics—per-core power, GPU frequency curves, DRAM bandwidth, even Thunderbolt topology—that never reach the user interface. Developers, DevOps↗ Bright Coding Blog engineers, and power users have been stuck with either proprietary profiling tools or hacky scripts requiring root privileges.
Enter mactop, the open-source terminal monitor that's making Apple's own utilities look obsolete. Written in Go by Carsen Klock and leveraging native Apple APIs without demanding sudo, mactop transforms your terminal into a mission control center for Apple Silicon. Real-time CPU and GPU usage? Check. E-Core and P-Core breakdowns? Absolutely. Power consumption, thermal states, fan control, and even RDMA detection over Thunderbolt 5? All there, all instant, all without elevated privileges.
If you've ever wondered why your MacBook sounds like it's preparing for liftoff—or why that "simple" Xcode build is melting your desk—mactop holds the answers. This isn't just another system monitor. It's the X-ray vision Apple never gave you. And in this guide, I'll show you exactly how to wield it.
What Is mactop?
mactop is a terminal-based system monitor specifically engineered for Apple Silicon architecture. Created by developer Carsen Klock and hosted at github.com/metaspartan/mactop, it delivers real-time hardware telemetry through an elegant terminal user interface (TUI) built on a customized fork of the gotui framework.
Unlike generic cross-platform monitors, mactop speaks Apple's native language. It interfaces directly with the System Management Controller (SMC), IOReport API, IOKit, and Mach Kernel API through Go's CGO bindings. This architecture matters because it bypasses the abstraction layers that dilute data in conventional tools. Where Activity Monitor shows "CPU Usage," mactop reveals which specific E-Core or P-Core is active, its individual load percentage, and the precise wattage it's consuming.
The project has gained serious traction in the developer community, evidenced by its Homebrew availability, extensive GitHub download metrics, and active maintenance. Its compatibility spans the entire Apple Silicon lineup—from the original M1 through the latest M5 Max with its revolutionary S-Core architecture. The tool requires only macOS Monterey 12.3+ and runs exclusively on ARM64, reflecting its deep hardware integration.
What makes mactop genuinely special is its zero-privilege design philosophy. By exploiting Apple's own APIs rather than kernel extensions or /dev node manipulation, it delivers enterprise-grade telemetry without the security risks of sudo escalation. This isn't just convenient—it's architecturally superior for production environments where least-privilege principles matter.
Key Features That Crush the Competition
mactop's feature set reads like a wishlist from frustrated Mac power users who finally decided to build their own solution. Here's what separates it from every alternative:
Native API Architecture, Zero Sudo Required The cornerstone advantage. mactop extracts data through SMC, IOReport, IOKit, and IOHIDEventSystemClient—Apple's blessed interfaces. No kernel panics from kexts. No security warnings. No password prompts breaking your flow.
Complete Silicon Telemetry
- CPU Metrics: Per-core utilization with E-Core/P-Core/S-Core classification (M5+ adds S-Cores)
- GPU Metrics: Frequency in MHz, utilization percentage, proportional per-process attribution (experimental)
- ANE: Apple Neural Engine power draw and utilization
- DRAM: Real-time read/write bandwidth in GB/s with auto-calibrated power-based estimation on M5+
- System Power: Package power, component breakdowns, total draw
Comprehensive Thermal Management
All SMC temperature sensors with human-readable labels: CPU Die, GPU, Memory, SSD, Airflow, and auxiliary sensors. Plus thermal state enumeration (Nominal/Fair/Serious/Critical) via NSProcessInfo.
Active Cooling Control
Real-time fan RPM with target speed, mode display (Auto/Manual), and visual RPM bars. The --fan-control flag enables interactive speed adjustment—though this writes to SMC and may require sudo on some macOS versions.
Thunderbolt Ecosystem Visibility Unique among monitors: real-time Thunderbolt bandwidth, connected device tree with speed negotiation, and RDMA over Thunderbolt 5 detection. Essential for external GPU users, high-speed storage arrays, and pro audio/video interfaces.
18 Customizable Layouts
Press l to cycle through presentation formats. Persistent settings remember your preferences across restarts. Colors? 15+ options including custom hex support. Background? Configurable. Party Mode? Obviously—hit p for randomized color cycling.
Headless & Integration Modes JSON, YAML, XML, CSV, and TOON output for scripting. Prometheus metrics server for monitoring stacks. Native macOS menu bar mode with sparkline charts. Floating overlay HUD with FPS metrics (requires Screen Recording permission).
Process Management
htop-format process list with VIRT in GB, CPU normalized by core count. Kill processes directly (F9 with confirmation). Filter by name (/). Vim-style navigation (g/G, j/k).
Internationalization 19 languages with automatic detection: English, Arabic, Chinese, Dutch, French, German, Hebrew, Hindi, Indonesian, Italian, Japanese, Korean, Polish, Portuguese, Russian, Spanish, Thai, Turkish, Vietnamese.
Real-World Use Cases Where mactop Dominates
Scenario 1: Video Encoding Pipeline Optimization
You're batch-processing 8K ProRes footage in Compressor. Activity Monitor shows "CPU 85%." Useless. mactop reveals your P-Cores are pegged at 98% while E-Cores idle at 12%, GPU frequency stuck at 450MHz because thermal throttling kicked in. You adjust your encoding preset to distribute ANE workload, watch DRAM bandwidth spike to 68 GB/s, and cut render time by 40%.
Scenario 2: External Thunderbolt Storage Debugging
Your RAID array benchmarks 40% below spec. mactop's Thunderbolt device tree shows the enclosure negotiated TB3 mode (20 Gb/s) instead of TB4 (40 Gb/s) on one bus. The network stats reveal packet errors on that interface. Cable swap fixes it—you diagnosed hardware negotiation failure from software telemetry.
Scenario 3: CI/CD Runner Capacity Planning
Your GitHub Actions self-hosted runner on M2 Ultra mysteriously slows during parallel builds. mactop's headless JSON output fed to Prometheus shows DRAM power cycling between 8W and 22W—memory bandwidth saturation, not CPU limitation. You reschedule jobs to stagger memory-intensive phases and eliminate queue bottlenecks.
Scenario 4: macOS Game Development Profiling
Unity build spikes thermal state to "Serious." mactop's overlay HUD floats above your game window showing GPU frequency throttling from 1398MHz to 892MHz exactly when frame times spike. You identify the shader compilation burst causing thermal runaway and implement async compilation.
Scenario 5: Fan Curve Customization for Studio Recording
Audio production demands silence. Default fan curves ramp aggressively. With --fan-control, you establish a manual 1200 RPM baseline that keeps thermal state "Nominal" during tracking sessions, accepting slight performance headroom tradeoff for zero audible noise.
Step-by-Step Installation & Setup Guide
Method 1: Homebrew (Recommended)
The fastest path to mactop goodness:
# Install via Homebrew
brew install mactop

# Launch immediately
mactop

# Update when new versions drop
brew update
brew upgrade mactop
Homebrew handles dependencies, PATH configuration, and clean uninstalls. This is the production-ready approach.
Method 2: Build from Source
For contributors, custom builds, or bleeding-edge features:
# Verify Go installation (1.21+ recommended)
go version

# Clone the repository
git clone https://github.com/metaspartan/mactop.git
cd mactop

# Build the binary
go build

# Execute
./mactop
The Go build produces a single static binary with no runtime dependencies beyond macOS system libraries.
Initial Configuration
Create the config directory for persistent settings:
mkdir -p ~/.mactop
Optional: Pre-configure your preferred defaults in ~/.mactop/config.json:
{
  "interval": 500,
  "foreground": "green",
  "background": "#22212C",
  "unit_temp": "celsius",
  "unit_network": "auto",
  "unit_disk": "auto"
}
Overlay Permission Setup (macOS 15+)
For FPS overlay functionality:
- Open System Settings → Privacy & Security → Screen Recording
- Enable your terminal application
- Restart terminal if prompted
- Verify with:
mactop --dump-fps
REAL Code Examples from mactop
Example 1: Basic Execution with Custom Theming
The simplest invocation with visual personalization:
# Launch with 1-second updates and green foreground
mactop --interval 1000 --foreground green

# Dracula theme using exact hex colors
mactop --foreground "#9580FF" --bg "#22212C"
The --interval flag controls refresh rate in milliseconds. Lower values increase responsiveness but raise CPU overhead for mactop itself. The --foreground and --bg flags accept named colors from mactop's palette or arbitrary hex values, enabling perfect theme matching with your terminal configuration.
Example 2: Headless JSON for Automation Pipelines
Extract structured data for external systems:
# Single sample, ideal for cron jobs or health checks
mactop --headless --count 1

# Continuous pretty-printed output for debugging
mactop --headless --pretty

# Alternative serialization formats
mactop --headless --format toon
mactop --headless --format yaml
The --headless flag suppresses the TUI entirely, streaming metrics to stdout. This enables integration with jq, Python↗ Bright Coding Blog scripts, or monitoring systems. The --count parameter limits samples for finite operations, while --pretty adds indentation for human readability during development.
Example 3: Prometheus Metrics Export
Enable observability stack integration:
# Start metrics server on port 2112
mactop -p 2112

# Then scrape from Prometheus with this job config:
# - job_name: 'mactop'
#   static_configs:
#     - targets: ['localhost:2112']
The Prometheus endpoint exports: CPU/GPU/ANE usage percentages, E/P/S-core averages, per-core utilization with core-type labels, power component breakdowns, DRAM bandwidth (read/write/combined), memory statistics, network throughput, disk I/O, fan RPM, all temperature sensors, thermal state enumeration, and Thunderbolt metrics. This transforms mactop from a local tool into a production monitoring source.
Example 4: Theme Customization with Per-Component Colors
Create ~/.mactop/theme.json for granular visual control:
{
  "foreground": "#B0BEC5",
  "background": "#212121",
  "cpu": "#FF5252",
  "gpu": "#448AFF",
  "memory": "#69F0AE",
  "ane": "#E040FB",
  "network": "#FFAB40",
  "power": "#FF6E40",
  "thunderbolt": "#E91E63",
  "processList": "#FFEB3B",
  "processListDim": "#555555",
  "processListSelected": "#FFFFFF",
  "systemInfo": "#00BCD4"
}
This colorful theme assigns distinct hues to each subsystem, enabling at-a-glance pattern recognition during heavy multitasking. The processListDim key specifically grays out root/system processes, reducing visual noise. Priority resolution follows: CLI flags override theme.json, which overrides saved config.
Example 5: Headless JSON Output Structure
Actual output from mactop --headless --count 1:
[{
  "timestamp": "2025-12-22T18:16:57-07:00",
  "soc_metrics": {
    "cpu_power": 2.196,
    "gpu_power": 5.386,
    "ane_power": 0,
    "dram_power": 5.702,
    "gpu_sram_power": 0.158,
    "system_power": 37.472,
    "total_power": 50.913,
    "gpu_freq_mhz": 643,
    "soc_temp": 62.563,
    "cpu_temp": 62.563,
    "gpu_temp": 58.389
  },
  "memory": {
    "total": 137438953472,
    "used": 74062512128,
    "available": 63376441344,
    "swap_total": 5368709120,
    "swap_used": 4094689280
  },
  "cpu_usage": 15.141,
  "gpu_usage": 53.520,
  "core_usages": [
    42.244, 37.171, 55.263, 37.705, 27.213,
    21.242, 14.563, 6.149, 4.194, 1.942,
    30.719, 20.847, 1.942, 1.294, 0.324,
    0, 0, 0, 0, 0
  ],
  "system_info": {
    "name": "Apple M1 Ultra",
    "core_count": 20,
    "e_core_count": 4,
    "p_core_count": 16,
    "gpu_core_count": 64
  },
  "thermal_state": "Normal"
}]
This structure reveals the precision density mactop achieves. Power values to milliwatt resolution. Temperatures to thousandths of a degree. Per-core arrays matching physical topology. The core_usages array indices correspond to Apple's hardware core order—on M1 Ultra, indices 0-3 are E-Cores, 4-19 are P-Cores. This raw data enables custom analytics impossible with aggregated tools.
Advanced Usage & Best Practices
Optimize Update Intervals for Your Workflow
Default 1000ms balances responsiveness and efficiency. For thermal event capture during benchmarks, drop to 250ms (- key or --interval 250). For background monitoring, raise to 5000ms to minimize observer effect.
Master the Layout System
With 18 layouts, memorization matters. The "Advanced" layout (cycle with l) shows maximum metrics density. The "Info" layout (i) emphasizes system identification. "Fan & Thermals" (Shift+F) isolates cooling data. Develop muscle memory for your three most-used layouts.
Leverage Freeze for Analysis
Press f to pause updates when you spot an anomaly. This captures transient states—like thermal throttling events or power spikes—that disappear in normal scrolling. Combined with g/G navigation and / filtering, you can dissect process behavior without data loss.
Script with Headless Output Parse headless JSON for automated decisions:
# Alert when GPU power exceeds 15W
mactop --headless --count 1 | jq '.[0].soc_metrics.gpu_power' | \
  awk '{if($1>15) print "HIGH GPU POWER: "$1"W"}'
Configure Overlay for Streaming
Content creators: the --overlay HUD with --dump-fps verification provides professional on-screen metrics without OBS plugin complexity. Customize collapsed_sections in ~/.mactop/config.json to show only FPS, CPU, GPU, Memory for clean presentation.
Monitor Thunderbolt Health
Regularly check thunderbolt_info in headless output. Degraded cables show as speed downgrades (40→20 Gb/s) or USB fallback modes. Proactive replacement prevents data corruption in external storage workflows.
Comparison with Alternatives
| Feature | mactop | Activity Monitor | asitop | htop | iStat Menus |
|---|---|---|---|---|---|
| Sudo Required | ❌ No | ❌ No | ✅ Yes | ❌ No | ❌ No |
| Apple Silicon Native | ✅ Deep integration | ⚠️ Generic | ✅ Yes | ❌ No | ✅ Yes |
| GPU Frequency | ✅ MHz + TFLOPs | ❌ No | ✅ Yes | ❌ No | ✅ Yes |
| Per-Core Type (E/P/S) | ✅ Full labeling | ❌ No | ✅ Yes | ❌ No | ⚠️ Partial |
| Power Metrics (W) | ✅ Component-level | ❌ No | ✅ Yes | ❌ No | ⚠️ Total only |
| DRAM Bandwidth | ✅ GB/s real-time | ❌ No | ❌ No | ❌ No | ❌ No |
| Thunderbolt Tree | ✅ Device + speed | ❌ No | ❌ No | ❌ No | ❌ No |
| RDMA Detection | ✅ TB5 ready | ❌ No | ❌ No | ❌ No | ❌ No |
| Fan Control | ✅ Interactive | ❌ No | ❌ No | ❌ No | ✅ Yes |
| Process Kill | ✅ Built-in | ✅ Yes | ❌ No | ✅ Yes | ❌ No |
| Prometheus Export | ✅ Native | ❌ No | ❌ No | ❌ No | ❌ No |
| Headless/Scriptable | ✅ Multiple formats | ❌ No | ❌ No | ❌ No | ❌ No |
| Menu Bar Mode | ✅ Sparklines | ❌ No | ❌ No | ❌ No | ✅ Yes |
| Overlay HUD | ✅ With FPS | ❌ No | ❌ No | ❌ No | ❌ No |
| Open Source | ✅ MIT | ❌ No | ✅ MIT | ✅ GPL | ❌ Commercial |
| Price | Free | Free | Free | Free | $14.99+ |
Why mactop wins: It's the only tool combining deep Apple Silicon telemetry, zero-privilege operation, open-source extensibility, and modern DevOps integration. Activity Monitor hides the details. asitop requires root and lacks export features. htop knows nothing about Apple's architecture. iStat Menus costs money and locks you into its ecosystem.
FAQ
Q: Does mactop work on Intel Macs?
A: No. mactop is Apple Silicon exclusive (ARM64). The SMC, IOReport, and Mach kernel interfaces differ fundamentally on Intel architecture. Use istats or intel-power-gadget for legacy hardware.
Q: Why doesn't my temperature match other tools?
A: mactop reads directly from SMC temperature sensors with Apple's official key mapping. Discrepancies usually indicate other tools using estimated values or different sensor locations. The --dump-temps flag shows all raw SMC keys for verification.
Q: Is fan control safe?
A: The --fan-control flag writes directly to SMC. While tested across multiple chips, manual override disables automatic thermal protection. Monitor temperatures closely, and use R (Shift+r) to restore auto mode immediately if thermal state rises above "Nominal."
Q: How do I fix "Screen Recording" permission errors for overlay?
A: On macOS 15+, enable your terminal app in System Settings → Privacy & Security → Screen Recording. Restart the terminal. Run mactop --dump-fps to verify CGDisplayStream access before launching overlay mode.
Q: Can I run mactop in a tmux or screen session?
A: Yes, the TUI renders correctly in terminal multiplexers. However, the --overlay HUD requires direct WindowServer access and may not function over SSH or in headless server environments.
Q: What's the performance impact of running mactop? A: Negligible. At default 1000ms interval, CPU usage stays under 0.5% on M-series chips. Even at 100ms updates, overhead remains below 2%. The Go runtime and efficient Apple API usage minimize observer effect.
Q: How do I contribute or report bugs?
A: Fork the repository, create a feature branch, and submit pull requests. For bug reports, include your chip model, macOS version, and output from mactop --dump-debug. The project actively welcomes contributions.
Conclusion
Apple Silicon represents a paradigm shift in computing architecture—heterogeneous cores, unified memory, neural engines, and power efficiency that redefines what's possible in a laptop. But you can't optimize what you can't measure. Apple's own tools deliberately abstract away this complexity, leaving developers and power users flying blind when performance matters most.
mactop shatters that opacity. With native API integration requiring zero elevation, granular per-component telemetry, and modern export capabilities for automation pipelines, it's the definitive Apple Silicon monitoring solution. Whether you're debugging thermal throttling in a game engine, capacity-planning CI infrastructure, or simply curious why your MacBook Pro sounds like a jet engine during Zoom calls, mactop delivers answers with precision and elegance.
The open-source MIT license means no vendor lock-in. The active development pace—already supporting M5's S-Cores and Thunderbolt 5 RDMA—means future-proofing. The 19-language i18n and extensive customization means it adapts to your workflow, not the reverse.
Stop accepting "CPU Usage" as sufficient information. Your Apple Silicon chip is screaming detailed telemetry every millisecond. Install mactop today, and finally listen to what it's saying.
brew install mactop && mactop
Get mactop now: github.com/metaspartan/mactop
Explore on the BrightCoding network
Hand-picked resources from our other sites.
DartSteven/Nutify: Modern Web Dashboard for NUT UPS Monitoring
DartSteven/Nutify is a modern, Docker-ready web dashboard for Network UPS Tools (NUT). Version 0.2.0 adds first-class multi-UPS monitoring, profile-aware setup,...
Stop Wasting Tokens: AgentOps Is the SDLC Layer Your Coding Agent Needs
AgentOps is the open-source SDLC control plane that gives coding agents persistent memory, validation gates, and compounding context. Install in 60 seconds and...
Kuberwastaken/claurst: Open-Source Agentic Coding in Rust
Kuberwastaken/claurst is a GPL-3.0 licensed, Rust-built terminal coding agent with multi-provider LLM support, ACP editor integration, and no telemetry. 10,086...
Continuez votre lecture
Why Alexandrie is the Ultimate Markdown Note-Taking App

Why CrossPaste is the Ultimate Game Changer for Clipboard Management

Why Chandra is the Ultimate OCR Tool for Handwriting and Tables

Stop Coding Alone: OPC-Skills Gives Your AI Agent Superpowers
Commentaires 0
Aucun commentaire pour l'instant. Soyez le premier à réagir !