Stop Squinting at netstat! Snitch Makes Network Inspection Beautiful
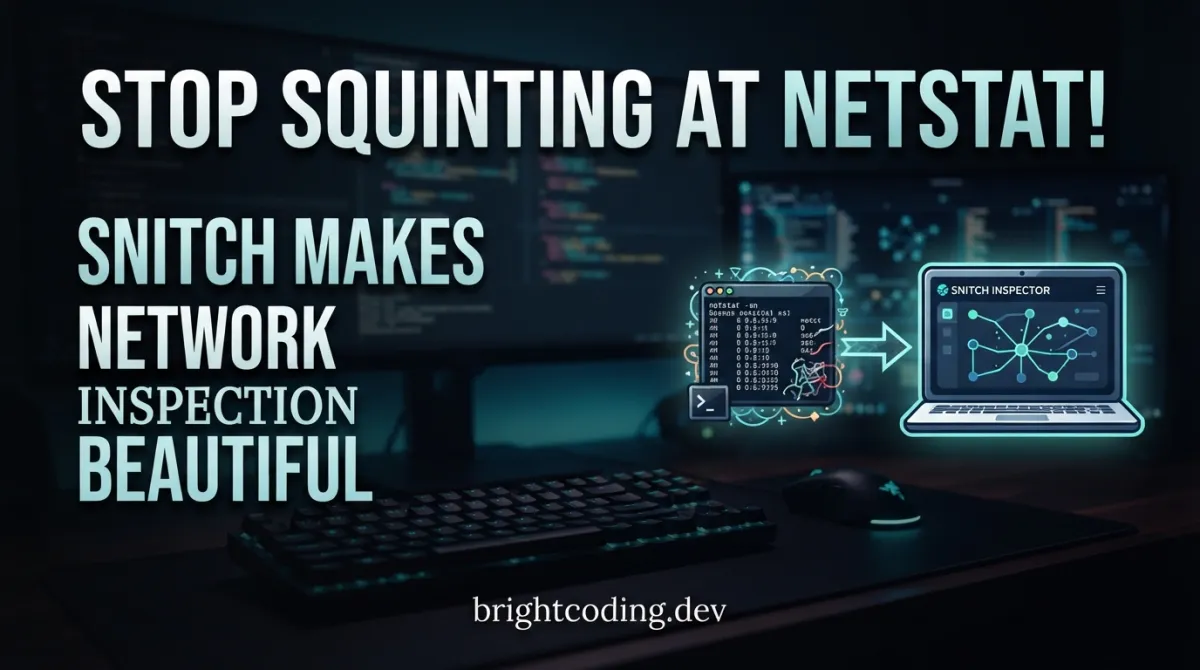
What if I told you that you've been inspecting network connections the wrong way your entire career?
Picture this: It's 2 AM. Your production server is acting up. Connections are dropping like flies. You frantically type netstat -tulpn and get blasted with a wall of misaligned, eye-bleeding text that looks like it was designed in 1983. You squint. You scroll. You pipe to grep five times. Still can't find that rogue connection eating your bandwidth.
Sound familiar?
Here's the dirty secret that elite SREs and platform engineers already know: the tools we've used for decades were built for machines, not humans. They dump raw data and expect your brain to do all the formatting work. In an era where we have gorgeous terminal UIs for everything from Git to Kubernetes, why are we still staring at ss output that looks like a CSV file had a bad day?
Enter snitch — the open-source network connection inspector that transforms this miserable experience into something you actually enjoy using. Built by Karol Broda and already making waves across GitHub, snitch is what happens when someone finally asks: "What if netstat didn't suck?"
This isn't just a pretty wrapper. It's a fundamentally reimagined tool that combines real-time monitoring, powerful filtering, and 16 gorgeous themes into a single binary that installs anywhere. Whether you're debugging a containerized microservice or hunting down a port conflict on your laptop, snitch turns network inspection from a chore into a superpower.
Ready to never type ss -s again? Let's dive in.
What is Snitch?
Snitch is a modern, human-friendly replacement for traditional network connection inspection tools like netstat, ss, and lsof -i. Hosted at github.com/karol-broda/snitch, it's written in Go and delivers both an interactive terminal UI (TUI) and styled table output for examining network sockets on Linux and macOS systems.
The project was created by Karol Broda with a crystal-clear mission: eliminate the friction of network debugging. While legacy tools force you to memorize dozens of flag combinations and parse cryptic output, snitch prioritizes discoverability and visual clarity. Every piece of information is presented in a clean, scannable format with intuitive keyboard navigation.
So why is snitch trending now? Three forces are converging:
-
The TUI renaissance: Tools like
lazygit,k9s, andbtmhave proven developers crave beautiful terminal interfaces. Snitch rides this wave perfectly. -
Container and cloud complexity: Modern infrastructure creates more network connections to debug, not fewer. When your single laptop runs 15 Docker↗ Bright Coding Blog containers, a Kubernetes cluster, and a mesh proxy, you need serious firepower to understand what's connected to what.
-
The Nix/homebrew ecosystem explosion: Snitch's availability across Homebrew, Nixpkgs, AUR, and Docker makes it trivial to adopt in any workflow — from personal laptops to immutable infrastructure.
Unlike tools that require root privileges or kernel modules, snitch intelligently reads from /proc/net/* on Linux and native APIs on macOS. It gracefully degrades when run without elevated permissions, showing available information rather than failing cryptically.
Key Features That Make Snitch Irresistible
Snitch isn't a shallow skin over existing tools. It rebuilds network inspection from the ground up with features that solve real operational pain points.
Dual Interface Modes
Launch snitch for a live-updating TUI, or run snitch ls for instant table output. The TUI auto-refreshes at configurable intervals (default 2s), while ls uses a pager when output exceeds your terminal — no more | less accidents.
Killer Keyboard Navigation
The TUI inherits vim-style bindings that feel instantly familiar: j/k to navigate, g/G for top/bottom, / to search, and enter for connection details. But it goes deeper — w watches a process (persistent highlighting), K kills with confirmation, and s/S cycles sorts with reverse. You'll never touch a mouse.
16 Production-Ready Themes
From catppuccin-mocha to tokyo-night-storm, gruvbox-dark to dracula — snitch ships with themes that match modern terminal setups. Set via config, environment variable (SNITCH_THEME), or home-manager module. Your eyes will thank you during that 3 AM incident.
Intelligent DNS Resolution
Parallel DNS lookups with built-in caching mean snitch resolves IPs to hostnames fast. Use --no-cache when debugging dynamic environments, or --resolve-ports to map port numbers to service names (443 → https).
Flexible Output Formats
Need machine-readable output? Snitch delivers: styled tables (default), plain parsable text (-p), JSON (-o json), CSV (-o csv), and streaming JSON frames (snitch watch). Pipe to jq, ingest into monitoring, or grep without fighting ANSI codes.
Advanced Filtering Without Memorization
Shortcut flags (-t, -u, -l, -e, -4, -6) work across all commands. But the real magic is key=value filtering: snitch ls proc=nginx lport=443 or snitch ls contains=google. No more | grep | grep | awk pipelines.
Zero-Dependency Binary
Single static binary. No runtime requirements. No Python↗ Bright Coding Blog virtualenv. No npm install. This matters when you're SSH'd into a minimal Alpine container at 2 AM.
Real-World Use Cases Where Snitch Shines
1. Debugging Container Port Conflicts
You're running Docker Compose and get "address already in use." Traditional approach: docker ps, docker port, sudo lsof -i :8080, mentally correlate container IDs. With snitch: snitch ls lport=8080 — instant process name, PID, and whether it's a container or host process.
2. Live Incident Response
Traffic spike hitting your API? Launch snitch, press t for TCP only, e for established, and watch connections in real-time. Spot the IP hammering your service, press enter for details, then K to kill the offending process — all without leaving the interface.
3. Security Auditing and Compliance
Need to prove no unexpected services are listening? snitch ls -l -p gives you a clean, parsable list of all listening sockets. Pipe to your SIEM, or run snitch watch -l -i 30s for continuous monitoring that outputs JSON frames.
4. Development Environment Sanity Checks
Microservices running locally? snitch -l shows exactly what's bound where. No more "wait, which service took port 3000?" mysteries. The visual process names make identification instant.
5. Remote Server Triage Over Slow SSH
On a laggy connection to a struggling server, every command counts. Snitch's TUI updates efficiently, and snitch ls with its built-in pager means you won't accidentally flood your terminal with 10,000 connections. The plain output mode (-p) is grep-friendly without escape sequences.
Step-by-Step Installation & Setup Guide
Snitch meets you where you are. Choose your path:
Homebrew (macOS/Linux)
# The fastest path for most developers
brew install snitch
Thanks to @bevanjkay for maintaining the Homebrew formula.
Go Install (Cross-Platform)
# Requires Go 1.21+; compiles from source automatically
go install github.com/karol-broda/snitch@latest
Nix/NixOS (The Power User Path)
# One-shot install
nix-env -iA nixpkgs.snitch

# Or try without installing
nix run github:karol-broda/snitch

# Flake input for reproducible builds
nix profile install github:karol-broda/snitch
For home-manager users, snitch provides a dedicated module with full configuration:
{
  inputs = {
    nixpkgs.url = "github:NixOS/nixpkgs/nixos-unstable";
    home-manager.url = "github:nix-community/home-manager";
    snitch.url = "github:karol-broda/snitch";
  };

  outputs = { nixpkgs, home-manager, snitch, ... }: {
    homeConfigurations."user" = home-manager.lib.homeManagerConfiguration {
      pkgs = nixpkgs.legacyPackages.x86_64-linux;
      modules = [
        snitch.homeManagerModules.default
        {
          programs.snitch = {
            enable = true;
            # optional: pin to flake's package instead of nixpkgs version
            # package = snitch.packages.x86_64-linux.default;
            settings = {
              defaults = {
                theme = "catppuccin-mocha";  # Your eyes deserve this
                interval = "2s";              # Live update frequency
                resolve = true;               # DNS resolution enabled
              };
            };
          };
        }
      ];
    };
  };
}
Available themes: ansi, catppuccin-mocha, catppuccin-macchiato, catppuccin-frappe, catppuccin-latte, gruvbox-dark, gruvbox-light, dracula, nord, tokyo-night, tokyo-night-storm, tokyo-night-light, solarized-dark, solarized-light, one-dark, mono.
Arch Linux (AUR)
# With yay
yay -S snitch-bin

# With paru
paru -S snitch-bin
Shell Script (Universal Fallback)
# Installs to ~/.local/bin or /usr/local/bin
curl -sSL https://raw.githubusercontent.com/karol-broda/snitch/master/install.sh | sh

# Custom install location
curl -sSL https://raw.githubusercontent.com/karol-broda/snitch/master/install.sh | INSTALL_DIR=~/bin sh
macOS note: The script automatically strips Gatekeeper quarantine attributes. To preserve them (rarely needed), set KEEP_QUARANTINE=1.
Docker (Containerized Environments)
# Pull minimal image (~9MB scratch, ~17MB alpine)
docker pull ghcr.io/karol-broda/snitch:latest-alpine

# Full host visibility requires namespace sharing
docker run --rm --net=host --pid=host --cap-add=SYS_PTRACE ghcr.io/karol-broda/snitch:latest ls
| Flag | Purpose |
|---|---|
--net=host |
See host network connections (required) |
--pid=host |
Resolve process names and PIDs |
--cap-add=SYS_PTRACE |
Read /proc/<pid> details |
Critical insight: Unlike many networking tools, snitch doesn't need CAP_NET_ADMIN or CAP_NET_RAW. It reads from /proc/net/*, which is accessible without special network capabilities.
Binary Download
Grab releases from GitHub:
# Linux example
tar xzf snitch_0.2.0_linux_amd64.tar.gz
sudo mv snitch /usr/local/bin/

# macOS quarantine fix if Gatekeeper blocks
xattr -d com.apple.quarantine /usr/local/bin/snitch
REAL Code Examples from the Repository
Let's examine actual usage patterns from the snitch README, with detailed explanations of what each accomplishes.
Example 1: Interactive TUI Launch
# Launch the full interactive interface — this is where snitch shines
snitch              # Default: all connections, live-updating TUI
snitch -l           # TUI filtered to listening sockets only
snitch -t           # TCP connections only
snitch -e           # Established connections only
snitch -i 2s        # Custom refresh interval (default is 2 seconds)
What's happening here: The bare snitch command launches the TUI with sensible defaults. The flags compose intuitively — -l for listen, -t for TCP, -e for established. The -i flag controls refresh rate; slower intervals reduce CPU usage on busy servers. Once inside, j/k navigate, t/u toggle TCP/UDP, l/e/o filter by state, and q quits. The w key is particularly powerful: it "watches" a process, highlighting it persistently even as the list updates.
Example 2: One-Shot Table Output with Filtering
# Styled table output for scripts and documentation
snitch ls               # Default styled table, auto-paged if long
snitch ls -l            # Listening sockets only
snitch ls -t -l         # TCP listeners (common for "what's running?")
snitch ls -e            # Established connections ("what's active?")
snitch ls -p            # Plain output: no colors, space-separated, grep-friendly
snitch ls -o json       # Machine-readable JSON for piping to jq
snitch ls -o csv        # Spreadsheet-compatible CSV output
snitch ls -n            # Numeric: skip DNS resolution, faster
snitch ls --no-headers  # Omit column headers for pure data processing
The -p (plain) flag is your friend when chaining with other tools. Unlike netstat where you fight ANSI escape codes, snitch's plain mode is genuinely clean. The -o json output includes all available fields, making it perfect for automation. Notice how flags compose: -t -l gives TCP listeners, combining protocol and state filters without complex syntax.
Example 3: Key-Value Filtering for Precision
# Exact match filtering using key=value syntax
snitch ls proto=tcp state=listen    # Equivalent to -t -l but explicit
snitch ls pid=1234                   # All connections for specific process
snitch ls proc=nginx                 # Filter by process name
snitch ls lport=443                  # What's listening on HTTPS port?
snitch ls contains=google            # Fuzzy match: any field containing "google"
This is where snitch departs from legacy tools. Instead of ss -tlnp | grep -i nginx | awk '{print $5}', you express intent directly. The contains= operator is especially powerful for quick searches without knowing exact values. These filters work on all ls subcommand variants, so snitch ls -o json proc=postgres gives you structured data for just PostgreSQL↗ Bright Coding Blog connections.
Example 4: Streaming JSON for Monitoring
# Continuous JSON output at specified interval
snitch watch -i 1s | jq '.count'           # Stream connection counts to jq
snitch watch -l -i 500ms                   # Watch listeners, update twice per second
The watch subcommand is a hidden gem. Unlike watch the Unix command (which reruns and clears screen), snitch watch outputs valid JSON Lines — one complete JSON object per line, suitable for ingestion by log shippers, metrics systems, or custom scripts. The -i flag accepts Go duration syntax: 500ms, 2s, 1m. Combine with jq for real-time dashboards or alerting thresholds.
Example 5: Configuration File
# ~/.config/snitch/snitch.toml
[defaults]
numeric = false      # Enable DNS and service name resolution
dns_cache = true     # Cache lookups for performance; disable with --no-cache
theme = "auto"       # Detect terminal background; override with specific theme

[tui]
remember_state = false   # When true, saves filter/sort state between sessions
State persistence is crucial for daily use. With remember_state = true, your preferred view (TCP only, sorted by PID, established connections) restores automatically. State lives at $XDG_STATE_HOME/snitch/tui.json (falling back to ~/.local/state/snitch/tui.json), respecting XDG directory standards.
Example 6: Environment Variable Overrides
# Quick overrides without editing config files
export SNITCH_THEME=dark          # Force dark theme variant
export SNITCH_RESOLVE=0           # Disable all DNS resolution (faster)
export SNITCH_DNS_CACHE=0         # Fresh lookups every time
export SNITCH_NO_COLOR=1          # Strip all ANSI codes for piping
export SNITCH_CONFIG=/etc/snitch  # Centralized config for servers
Environment variables take priority over config file but yield to CLI flags. This layering makes snitch predictable in automation: set SNITCH_NO_COLOR=1 in CI pipelines, override with --resolve-addrs when debugging specific hosts.
Advanced Usage & Best Practices
Performance on High-Connection Servers
For machines with 50,000+ connections, use snitch ls -n -p first. Disabling DNS resolution (-n) and using plain output eliminates formatting overhead. If you need the TUI, increase interval: snitch -i 5s reduces refresh CPU by 60%.
Docker Debugging Workflow
# Create a shell alias for container debugging
alias ds='docker run --rm --net=host --pid=host --cap-add=SYS_PTRACE ghcr.io/karol-broda/snitch:latest'

# Usage: ds ls -l  # All host listeners from inside a container
Integration with tmux/screen
Snitch's TUI works beautifully in tmux panes. Pro tip: run snitch in a small pane alongside logs, creating a live network dashboard. The catppuccin-mocha theme specifically complements modern terminal color schemes.
Security-Conscious Environments
Since snitch doesn't require CAP_NET_ADMIN, you can run it in restricted containers or with reduced privileges. The only capability needed for full process info is SYS_PTRACE — and that's optional, not mandatory.
Home-Manager Nix Reproducibility
Pin your snitch version in flakes for team consistency:
snitch.url = "github:karol-broda/snitch?ref=v0.2.0";
Comparison with Alternatives
| Feature | snitch | ss |
netstat |
lsof -i |
iftop |
|---|---|---|---|---|---|
| Interactive TUI | ✅ Native | ❌ | ❌ | ❌ | ✅ Limited |
| Styled Tables | ✅ 16 themes | ❌ | ❌ | ❌ | ❌ |
| JSON/CSV Output | ✅ Built-in | ❌ | ❌ | ❌ | ❌ |
| Live Refresh | ✅ Configurable | ❌ | ❌ | ❌ | ✅ Fixed |
| Process Kill from UI | ✅ K key |
❌ | ❌ | ❌ | ❌ |
| DNS Caching | ✅ Parallel + cache | ❌ | ❌ | ❌ | ❌ |
| Key-Value Filtering | ✅ proc=nginx |
❌ | ❌ | ❌ | ❌ |
| Cross-Platform | ✅ Linux/macOS | Linux only | Deprecated | ✅ | ✅ |
| Single Binary | ✅ Zero deps | Part of iproute2 | Part of net-tools | Usually preinstalled | Separate install |
| Container-Aware | ✅ | Manual | Manual | Manual | ❌ |
The verdict: ss and netstat are system utilities, not user experiences. iftop shows bandwidth, not connections. Only snitch combines comprehensive connection data with modern interface paradigms. For daily operational work, the time saved on parsing output and composing pipelines pays back the installation effort in hours, not days.
FAQ
Q: Does snitch require root privileges?
A: No. On Linux, snitch reads from /proc/net/* which is world-readable. Root or CAP_NET_ADMIN is only needed for full process information on some systems. On macOS, sudo may enhance process visibility but isn't strictly required.
Q: Can I use snitch in Docker containers?
A: Absolutely. Pre-built images are available from GitHub Container Registry. Use --net=host to see host connections, --pid=host for process names, and --cap-add=SYS_PTRACE for /proc details. No CAP_NET_ADMIN needed.
Q: How does snitch compare to ss -tulpn?
A: ss -tulpn is faster for raw data extraction in scripts, but snitch wins on readability, interactivity, and composability. For one-off checks in terminals, snitch is dramatically faster for humans. For pure automation pipelines, use snitch ls -p or snitch json.
Q: Is DNS resolution slow on busy servers?
A: Snitch uses parallel DNS lookups with caching. For maximum speed, use -n (numeric) or set SNITCH_RESOLVE=0. Use --no-cache only when debugging dynamic DNS environments.
Q: Can I theme snitch to match my terminal? A: Sixteen themes ship by default including Catppuccin variants, Gruvbox, Dracula, Nord, Tokyo Night, Solarized, and One Dark. Set via config, environment variable, or home-manager module.
Q: Does snitch work on Windows? A: Currently Linux and macOS only. Windows support would require implementing over the WinSock APIs; no timeline is committed.
Q: How do I upgrade snitch?
A: Built-in: snitch upgrade checks and installs. Or snitch upgrade --yes for unattended. Pin versions with snitch upgrade -v 0.2.0.
Conclusion
We've tolerated terrible network tools for too long. netstat was deprecated. ss improved the data but not the experience. And somehow, we normalized squinting at misaligned columns while our production systems burned.
Snitch is the reset button.
It takes everything frustrating about connection inspection — the parsing, the memorization, the eye strain — and replaces it with something that feels obvious in retrospect. A beautiful TUI. Instant filtering. Multiple output formats. Zero dependencies. Sixteen themes that make 2 AM incidents slightly less miserable.
I've switched entirely. My .bashrc no longer aliases netstat to anything. When I need to know what's listening, what's connected, or what's misbehaving, snitch is the only tool I reach for.
Your move. Install it in thirty seconds, run snitch, and tell me you don't feel a little spark of joy when that clean interface appears. The future of network debugging is here — and it doesn't look like a CSV file.
⭐ Star the project on GitHub: github.com/karol-broda/snitch
🚀 Install now: brew install snitch or go install github.com/karol-broda/snitch@latest
Explore on the BrightCoding network
Hand-picked resources from our other sites.
JumpServer: The PAM Platform for DevOps Team
JumpServer is an open-source PAM platform revolutionizing secure infrastructure access. Learn how to deploy this powerful bastion host solution in minutes and m...
Cronicle: The Essential Distributed Scheduler for Modern DevOps
Master distributed task scheduling with Cronicle's web UI, automatic failover, and language-agnostic plugins. Complete installation guide, real code examples, a...
Harbour: The Essential Docker Controller for Apple Devices
Harbour is a native Apple app that revolutionizes Docker container management through iOS, iPadOS, and macOS. With widgets, Siri Shortcuts, and zero telemetry,...
Continuez votre lecture
Build a Secure SSH Workspace with SFTP & Terminals

Build Circuit Boards with Code: Guide to Software-Driven PCB Design (atopile Tutorial 2026)

Why PatchMon is the Ultimate Game Changer for Linux Patch Management

Stop Coding Alone: OPC-Skills Gives Your AI Agent Superpowers
Commentaires 0
Aucun commentaire pour l'instant. Soyez le premier à réagir !