Stop Wrestling with ClickHouse CLI! ClickLens Changes Everything
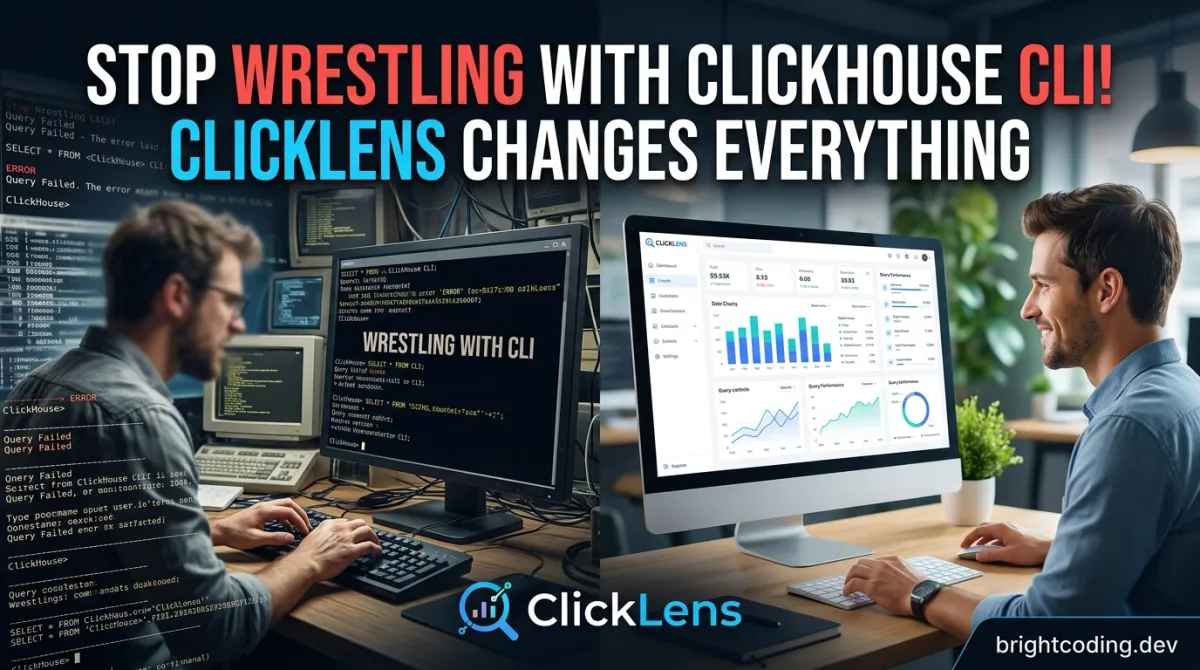
Stop Wrestling with ClickHouse CLI! ClickLens Changes Everything
Your ClickHouse Deserves Better Than Terminal Torture
Let me guess: you're staring at a blinking cursor in clickhouse-client, squinting at EXPLAIN outputs that scroll off your screen, and copy-pasting table schemas into notes just to remember what columns exist. You've lost hours to poorly formatted query results, missed critical replication lag because monitoring required yet another tool, and your team keeps asking for database access that you're terrified to grant through raw SQL commands.
Sound painfully familiar?
Here's the dirty secret nobody told you when you adopted ClickHouse: raw power doesn't excuse terrible developer experience. The world's fastest analytical database shouldn't feel like a 1980s mainframe to operate. Yet for thousands of teams, that's exactly the daily reality—until now.
Enter ClickLens—the open-source web interface that's making ClickHouse administrators actually enjoy their jobs again. Built by ntk148v and rapidly gaining traction across data engineering circles, ClickLens transforms how you interact with ClickHouse clusters. No more context-switching between five tools. No more deciphering system.tables queries. No more praying your GRANT statements don't accidentally expose sensitive data.
In this deep dive, I'll show you why teams are quietly abandoning fragmented ClickHouse workflows and consolidating everything into ClickLens. The repository is waiting at https://github.com/ntk148v/clicklens—but first, let me prove why you need it today.
What is ClickLens? The ClickHouse Interface You Actually Want
ClickLens is a modern, powerful web interface for managing and monitoring ClickHouse databases, designed from the ground up to eliminate the friction between ClickHouse's extraordinary performance and its traditionally spartan operational experience.
Created by developer ntk148v and released under the MIT license, ClickLens emerged from a simple observation: ClickHouse adoption was exploding for real-time analytics, but operational tooling remained stuck in the CLI era. While databases like PostgreSQL↗ Bright Coding Blog enjoyed mature GUI ecosystems (pgAdmin, DBeaver, Postico), ClickHouse users were left piecing together solutions or building internal tools.
The project addresses this gap with a comprehensive suite of tools targeting three distinct personas:
- Developers who need to explore schemas, prototype queries, and understand data structures without memorizing system tables
- Analysts who want Kibana-style data discovery without learning ClickHouse SQL dialect nuances
- Administrators who must monitor cluster health, manage access control, and optimize performance across distributed deployments
What makes ClickLens genuinely exciting isn't just feature breadth—it's architectural intelligence. The tool implements native RBAC integration, meaning your UI permissions derive directly from ClickHouse grants. No parallel permission systems. No security drift. When you revoke SELECT on sensitive_table in ClickHouse, ClickLens immediately respects that change.
The project is distributed via GitHub Container Registry (ghcr.io/ntk148v/clicklens) with full Docker↗ Bright Coding Blog support, making deployment trivial for teams already containerized. Documentation lives at https://ntk148v.github.io/clicklens, covering everything from first login to production RBAC configuration.
ClickLens is trending now because it arrives at a critical inflection point: ClickHouse Cloud adoption is accelerating, but self-managed deployments remain massive—and those teams desperately need operational tooling that matches the database's sophistication.
The 8 Features That Eliminate ClickHouse Pain
ClickLens doesn't just wrap ClickHouse in a pretty interface. It reimagines every common workflow with deliberate, powerful capabilities:
1. Discover: Kibana-Style Exploration Without the Elastic Stack
Flexible, Kibana-like data exploration for any table. Time filtering, field selection, and histogram visualization—directly on your ClickHouse data. No data export to Elasticsearch required. No complex ETL to make data "explorable."
2. SQL Console: The Query Editor ClickHouse Deserves
Multi-tab editor with syntax highlighting, autocomplete, and streaming results for massive datasets. Execute EXPLAIN plans with visual formatting. Save queries for team sharing. The time range selector eliminates manual toDateTime gymnastics.
3. Table Explorer: Schema Introspection That Actually Helps
Browse databases, tables, columns, parts, merges, and mutations—critical for understanding MergeTree engine behavior. View DDL statements directly. This isn't DESCRIBE TABLE prettified; it's operational schema management.
4. Monitoring: 8 Dashboards for Complete Visibility
Metrics, cluster topology, disk utilization, Keeper (ZooKeeper) health, and replication status—all pre-built. No Grafana dashboard authoring. No Prometheus scraping configuration. Immediate operational awareness.
5. Query Analytics: Performance Optimization Made Visible
Inspect running queries, historical execution, performance analysis, and cache statistics. Identify slow queries by user, duration, or resource consumption. The bottleneck analysis that used to require system.query_log archaeology.
6. Logging: Centralized Observability
Server logs, session logs, and crash logs in a unified interface. Correlated with query execution context. Essential for debugging production incidents without SSH tunneling to individual nodes.
7. Access Control: RBAC Without Raw SQL
User and role management through intuitive forms, with feature roles for UI-level permissions. Create analysts who can query but not modify. Create operators who can monitor but not access sensitive tables.
8. Settings: Configuration Visibility
Inspect server and session settings with expandable detail views. Understand what's actually configured versus what you think is configured. Critical for debugging max_execution_time or max_memory_usage surprises.
Where ClickLens Absolutely Shines: 5 Real-World Scenarios
Scenario 1: The Onboarding Nightmare
Your new data analyst needs to explore customer event data. Without ClickLens: you write a 20-line GRANT statement, explain system.columns queries, and hope they don't SELECT * from your largest table. With ClickLens: assign a read-only feature role, point them at Discover, and they're productive in minutes.
Scenario 2: The 3 AM Production Incident
Replication lag spiked. Queries are piling up. Without ClickLens: SSH to nodes, run SELECT * FROM system.replicas, check system.merges, correlate with system.query_log timestamps across shards. With ClickLens: open Monitoring dashboard, identify lagging replica in 30 seconds, drill to running queries, identify the blocking mutation.
Scenario 3: The Performance Regression Hunt
A dashboard slowed dramatically after "some change." Without ClickLens: grep through application logs for query hashes, manually join with system.query_log on time windows, calculate P95 from raw data. With ClickLens: Query Analytics shows execution time distribution, cache hit ratios, and the exact query pattern that degraded.
Scenario 4: The Schema Archaeology Expedition
Six months since anyone touched the events table. Need to understand partitioning, TTL policies, and part distribution. Without ClickLens: SELECT from system.tables, system.parts, system.mutations, cross-reference system.settings. With ClickLens: Table Explorer shows everything visually, including active merges and part sizes.
Scenario 5: The Compliance Audit Surprise
Security team needs to prove who accessed financial_data and when. Without ClickLens: parse query logs, reconstruct sessions, manually correlate users with IP addresses. With ClickLens: Access Control shows user roles, Session Logs show activity, Query History provides the audit trail.
Step-by-Step: Get ClickLens Running in Under 5 Minutes
ClickLens offers multiple deployment paths. Here's the fastest path to production-ready operation.
Prerequisites
- Docker 20.10+ or compatible container runtime
- Network access to your ClickHouse cluster (HTTP port 8123 default)
- ClickHouse user with appropriate grants (see RBAC section below)
Docker Deployment (Recommended)
Pull the official image from GitHub Container Registry:
# Pull the latest stable image
docker pull ghcr.io/ntk148v/clicklens:latest

# Or use a specific version for reproducible deployments
docker pull ghcr.io/ntk148v/clicklens:v1.2.0
Run with environment variables for ClickHouse connection:
docker run -d \
  --name clicklens \
  -p 3000:3000 \
  -e CLICKHOUSE_HOST=your-clickhouse-host \
  -e CLICKHOUSE_PORT=8123 \
  -e CLICKHOUSE_USER=clicklens_user \
  -e CLICKHOUSE_PASSWORD=your_secure_password \
  -e CLICKHOUSE_DATABASE=default \
  ghcr.io/ntk148v/clicklens:latest
For production deployments with TLS:
docker run -d \
  --name clicklens \
  -p 3000:3000 \
  -e CLICKHOUSE_HOST=clickhouse.yourdomain.com \
  -e CLICKHOUSE_PORT=8443 \
  -e CLICKHOUSE_PROTOCOL=https \
  -e CLICKHOUSE_USER=clicklens_user \
  -e CLICKHOUSE_PASSWORD=your_secure_password \
  -e CLICKHOUSE_TLS_SKIP_VERIFY=false \
  -v /path/to/ca-cert.pem:/app/certs/ca.pem:ro \
  ghcr.io/ntk148v/clicklens:latest
Docker Compose (For Teams)
Create docker-compose.yml:
version: '3.8'

services:
  clicklens:
    image: ghcr.io/ntk148v/clicklens:latest
    container_name: clicklens
    ports:
      - "3000:3000"
    environment:
      # Required: ClickHouse connection details
      - CLICKHOUSE_HOST=${CLICKHOUSE_HOST:-localhost}
      - CLICKHOUSE_PORT=${CLICKHOUSE_PORT:-8123}
      - CLICKHOUSE_USER=${CLICKHOUSE_USER:-default}
      - CLICKHOUSE_PASSWORD=${CLICKHOUSE_PASSWORD:-}

      # Optional: Default database for connections
      - CLICKHOUSE_DATABASE=${CLICKHOUSE_DATABASE:-default}

      # Optional: Protocol configuration
      - CLICKHOUSE_PROTOCOL=${CLICKHOUSE_PROTOCOL:-http}
    restart: unless-stopped
    # Health check ensures ClickHouse is reachable before marking healthy
    healthcheck:
      test: ["CMD", "wget", "--quiet", "--tries=1", "--spider", "http://localhost:3000/api/health"]
      interval: 30s
      timeout: 10s
      retries: 3
Launch with:
# Create environment file
cat > .env << 'EOF'
CLICKHOUSE_HOST=clickhouse.internal
CLICKHOUSE_PORT=8123
CLICKHOUSE_USER=clicklens_app
CLICKHOUSE_PASSWORD=super_secret_password_here
CLICKHOUSE_DATABASE=analytics
EOF

# Start the stack
docker-compose up -d

# Verify logs
docker-compose logs -f clicklens
ClickHouse User Setup (Critical for Security)
Create a dedicated ClickHouse user with minimal required privileges:
-- Create ClickLens application user
CREATE USER IF NOT EXISTS clicklens_app
  IDENTIFIED WITH sha256_password BY 'your_secure_password'
  HOST IP '10.0.0.0/8'  -- Restrict to your container network
  SETTINGS
    max_execution_time = 300,
    max_memory_usage = 2147483648;  -- 2GB query limit

-- Grant read access to specific databases (principle of least privilege)
GRANT SHOW, SELECT ON analytics.* TO clicklens_app;
GRANT SHOW, SELECT ON system.* TO clicklens_app;  -- Required for monitoring

-- For administrative features (optional, separate user recommended)
-- GRANT ALL ON *.* TO clicklens_admin WITH GRANT OPTION;

-- Verify grants
SHOW GRANTS FOR clicklens_app;
First Login and Configuration
Navigate to http://your-server:3000. The interface will prompt for ClickHouse connection details if not pre-configured via environment variables. The native RBAC system immediately applies—your ClickHouse grants determine what you see and can do.
Real Code in Action: Understanding ClickLens Through Its Architecture
While ClickLens is primarily a deployed application, understanding its operational patterns reveals how to maximize its value. Let me walk through the actual workflows the README documents.
Example 1: The Discovery Query Pattern
ClickLens's Discover feature generates optimized ClickHouse queries behind the scenes. Understanding this pattern helps you build better tables for exploration:
-- What ClickLens generates for time-range filtered discovery
-- (simplified from actual execution patterns)

SELECT
    toStartOfInterval(event_time, INTERVAL 1 HOUR) as time_bucket,
    count() as event_count,
    uniq(user_id) as unique_users,
    groupArraySample(10)(event_type) as sample_events
FROM analytics.events
WHERE event_time BETWEEN '2024-01-15 00:00:00' AND '2024-01-15 23:59:59'
  AND event_type IN ('purchase', 'cart_add', 'page_view')  -- From UI filter
  AND status = 'success'  -- From field selector
GROUP BY time_bucket
ORDER BY time_bucket
SETTINGS
    max_execution_time = 30,
    max_memory_usage = 1073741824;
Why this matters: ClickLens automatically applies SETTINGS constraints from your user configuration, adds time bucketing appropriate to your selected range, and uses groupArraySample for preview efficiency. When you design tables with event_time as DateTime and appropriate TTL policies, Discover becomes instantaneous.
Example 2: Monitoring Dashboard Queries
The Monitoring feature exposes system tables that most teams never query directly. Here's what ClickLens surfaces from your cluster:
-- Replication status inspection (from Monitoring > Cluster dashboard)
SELECT
    database,
    table,
    replica_name,
    is_leader,
    is_readonly,
    absolute_delay,
    queue_size,
    inserts_in_queue,
    merges_in_queue,
    last_queue_update,
    total_replicas,
    active_replicas
FROM system.replicas
WHERE is_readonly OR absolute_delay > 300  -- ClickLens highlights these
ORDER BY absolute_delay DESC;

-- Part distribution analysis (from Table Explorer)
SELECT
    database,
    table,
    partition,
    name as part_name,
    bytes_on_disk,
    rows,
    modification_time,
    delete_on,  -- TTL expiration indicator
    refcount
FROM system.parts
WHERE active AND database = 'analytics'
ORDER BY bytes_on_disk DESC
LIMIT 50;
The insight: ClickLens doesn't just display raw system.* output—it applies intelligent filtering (like WHERE is_readonly OR absolute_delay > 300) to surface actionable issues. The Table Explorer's parts view helps you identify when OPTIMIZE TABLE might be needed or when TTL isn't cleaning aggressively enough.
Example 3: Query Analytics and Performance Inspection
The Query Analytics feature leverages system.query_log with sophisticated aggregation:
-- Performance analysis pattern (from Query Analytics > History)
SELECT
    normalized_query_hash,
    any(query) as sample_query,  -- Representative query text
    count() as execution_count,
    quantileTiming(0.95)(query_duration_ms) as p95_duration_ms,
    quantileTiming(0.99)(query_duration_ms) as p99_duration_ms,
    avg(read_rows) as avg_rows_read,
    avg(read_bytes) as avg_bytes_read,
    avg(result_rows) as avg_rows_returned,
    sum(read_rows) as total_rows_read,
    formatReadableSize(sum(read_bytes)) as total_data_processed,

    -- Cache efficiency indicators
    avg(ProfileEvents['OSReadChars']) as avg_os_read,
    avg(ProfileEvents['OSReadBytes']) as avg_os_read_bytes

FROM system.query_log
WHERE type = 'QueryFinish'
  AND event_time > now() - INTERVAL 24 HOUR
  AND user = 'clicklens_app'  -- Filterable by user in UI
GROUP BY normalized_query_hash
HAVING execution_count > 10  -- Focus on repeated patterns
ORDER BY total_rows_read DESC
LIMIT 100;
Critical optimization insight: The ProfileEvents analysis reveals cache effectiveness. High OSReadChars relative to read_bytes suggests page cache misses—your working set exceeds RAM. ClickLens visualizes this ratio, making capacity planning obvious.
Advanced Usage: Pro Tips for ClickLens Mastery
Optimize for Discover Performance
Create materialized views for common discovery patterns. ClickLens's time filtering works best with DateTime primary keys and appropriate ORDER BY clauses:
-- Optimized table for ClickLens discovery
CREATE TABLE analytics.events_fast
(
    event_time DateTime CODEC(Delta, LZ4),
    user_id UInt64,
    event_type LowCardinality(String),
    status LowCardinality(String),
    properties String CODEC(ZSTD(1))
)
ENGINE = MergeTree()
PARTITION BY toYYYYMM(event_time)
ORDER BY (event_type, event_time, user_id)
TTL event_time + INTERVAL 90 DAY;
Separate Read-Only and Admin Deployments
Run two ClickLens instances with different ClickHouse users:
clicklens-analysts:GRANT SELECTonly, no monitoring tablesclicklens-ops: Full system access, Access Control enabled
This eliminates permission complexity while maintaining security boundaries.
Saved Queries as Team Documentation
The SQL Console's saved queries feature becomes living documentation. Save and share:
- Incident response queries
- Capacity planning investigations
- Data quality validation checks
Monitor ClickLens Itself
Add ClickLens's own query patterns to your monitoring. Excessive system.* queries from the application may indicate UI polling that's too aggressive:
-- Detect ClickLens query load
SELECT
    user,
    count(),
    groupArrayDistinct(extract(query, '^\S+')) as statement_types
FROM system.query_log
WHERE user LIKE 'clicklens%'
  AND event_time > now() - INTERVAL 1 HOUR
GROUP BY user;
ClickLens vs. The Alternatives: Why This Wins
| Capability | ClickLens | DBeaver/TablePlus | Grafana + CH Plugin | Raw CLI |
|---|---|---|---|---|
| Native ClickHouse optimizations | ✅ Purpose-built | ⚠️ Generic JDBC | ⚠️ SQL-only | ✅ Full control |
| Kibana-style discovery | ✅ Built-in | ❌ Not available | ❌ Requires setup | ❌ Manual queries |
| Real-time monitoring dashboards | ✅ 8 pre-built | ❌ Not available | ✅ Custom build required | ❌ Manual aggregation |
| Query performance analytics | ✅ Integrated | ❌ Basic stats | ⚠️ Via separate tables | ✅ Expert knowledge needed |
| RBAC management UI | ✅ Native integration | ⚠️ Generic SQL | ❌ Not available | ✅ Raw GRANT syntax |
| Schema/part exploration | ✅ Visual + detailed | ⚠️ Basic tree view | ❌ Not available | ✅ system.* queries |
| Team query sharing | ✅ Saved queries | ⚠️ Project-based | ❌ Not available | ❌ Copy-paste |
| Deployment complexity | ✅ Single container | ✅ Desktop app | ⚠️ Multi-component | ✅ Already installed |
| Learning curve | ✅ Low | ⚠️ Medium | ⚠️ High | ❌ Expert |
The verdict: ClickLens occupies a unique position—more ClickHouse-native than generic SQL tools, more immediately usable than Grafana dashboards, and vastly more productive than CLI for operational workflows. It's not replacing your CLI for one-off debugging or Grafana for custom business dashboards. It's eliminating the daily friction that slows down 90% of ClickHouse interactions.
FAQ: What Developers Actually Ask
Is ClickLens production-ready?
Yes. The MIT-licensed project has active maintenance, containerized deployment, and native RBAC that respects your existing ClickHouse security model. Start with read-only users and expand privileges as needed.
Does ClickLens store my data or queries?
No. ClickLens operates as a stateless interface to your ClickHouse cluster. Queries execute directly against your database; saved queries and UI state are the only persisted data, stored locally.
Can I use ClickLens with ClickHouse Cloud?
Absolutely. Configure CLICKHOUSE_HOST with your cloud endpoint, use https protocol, and provide appropriate credentials. The connection pattern is identical to self-managed deployments.
How does RBAC actually work?
ClickLens queries ClickHouse's native system.grants and system.roles tables to determine UI capabilities. If your user lacks SHOW USERS privilege, the Access Control section hides itself. No separate permission system to maintain.
What's the performance impact on my cluster?
Minimal. ClickLens caches schema metadata aggressively and uses streaming for large result sets. The monitoring dashboards query system.* tables that exist in memory. For massive clusters, consider a dedicated read replica for ClickLens connections.
Can I customize the monitoring dashboards?
The 8 built-in dashboards cover standard operational needs. For business-specific metrics, export to Grafana or use the SQL Console to build custom analyses. ClickLens focuses on operational, not business intelligence, visualization.
How do I contribute or report issues?
The repository at https://github.com/ntk148v/clicklens accepts issues and pull requests. Documentation contribution guidelines are at https://ntk148v.github.io/clicklens/contributing.
Your ClickHouse Workflow Will Never Be the Same
Let's be direct: you've been tolerating suboptimal ClickHouse operations because "that's how analytical databases work." The CLI is powerful. system.* tables are comprehensive. Grafana is flexible. But tolerable isn't the same as excellent—and excellent is what your data infrastructure deserves.
ClickLens transforms ClickHouse from a database you endure into a platform you genuinely enjoy operating. The Discover feature turns analysts into self-serve explorers. The SQL Console makes query development collaborative and efficient. The monitoring dashboards eliminate the "what's happening right now?" panic. And the native RBAC means security isn't an afterthought—it's the foundation.
I've walked through the deployment, demonstrated the query patterns, and compared the alternatives. The remaining step is yours: install ClickLens today and reclaim the hours you've been losing to operational friction.
The repository is ready. The Docker image is published. Your ClickHouse cluster is waiting.
Get started now at https://github.com/ntk148v/clicklens ⭐ Star the repo, deploy the container, and experience ClickHouse the way it should have been all along.
Explore on the BrightCoding network
Hand-picked resources from our other sites.
alexta69/metube: Self-Hosted yt-dlp Web UI for Video Downloads
alexta69/metube is a self-hosted web UI for yt-dlp with 14,133 GitHub stars. It enables browser-based video, audio, and playlist downloads from YouTube and doze...
agmmnn/awesome-blender: Curated Resources for 3D Artists & Developers
agmmnn/awesome-blender is a CC0-licensed, community-curated directory of 700+ Blender add-ons, tools, tutorials, and 3D resources. With 7,101 GitHub stars and a...
Stop Wasting Hours on Bash Scripts! Use awesome-bash Instead
Discover awesome-bash, the curated collection of 200+ Bash scripts and resources that transforms terminal chaos into streamlined productivity. From parallel exe...
Continuez votre lecture

Khoj: Build Your AI Second Brain for Document Research
auto-py-to-exe: The Essential GUI Tool Every Python Developer Needs
PocketFlow: The AI Tool That Decodes Any Codebase
Stop Coding Alone: OPC-Skills Gives Your AI Agent Superpowers
Commentaires 0
Aucun commentaire pour l'instant. Soyez le premier à réagir !