mwaskom/seaborn: Statistical Visualization for Pandas Workflows
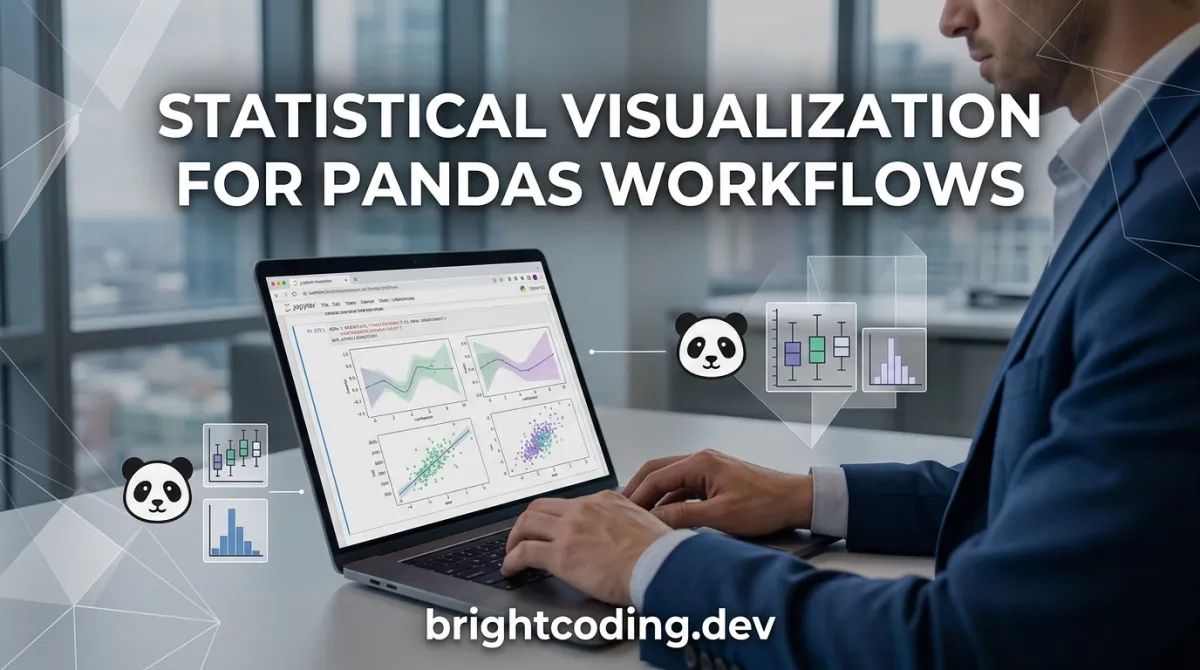
mwaskom/seaborn is a Python statistical visualization library built on matplotlib with native Pandas DataFrame support. 13,960 stars, BSD 3-Clause licensed, Python 3.10+.
Découvrez nos guides, tutoriels et actualités sur les formats web, le Markdown et les bonnes pratiques de développement.
mwaskom/seaborn is a Python statistical visualization library built on matplotlib with native Pandas DataFrame support. 13,960 stars, BSD 3-Clause licensed, Python 3.10+.
My-Jogyo is a multi-agent research automation system that transforms OpenCode into a scientific laboratory. With Professor (Gyoshu) planning, TA (Jogyo) executing, and PhD reviewer (Baksa) verifying, it produces reproducible notebooks with statistical rigor—automatically.
Discover CausalML by Uber - the powerful Python package for uplift modeling and causal inference. Learn how to estimate heterogeneous treatment effects and optimize interventions with machine learning for maximum ROI.
Transform your terminal into a powerful data visualization studio with YouPlot. Create bar charts, histograms, scatter plots & more instantly from the command line without GUI dependencies.
Zasper is a high-performance IDE for Jupyter Notebooks that delivers 40X less RAM usage and 5X lower CPU consumption. Discover how its concurrent architecture transforms data science workflows.
Discover how awesome-ai-awesomeness revolutionizes AI resource discovery with 1000+ curated tools, frameworks, and research papers organized into a community-driven GitHub repository that saves developers 80% of their research time.
Automate time series feature extraction with tsfresh. This powerful Python library extracts 100+ features via hypothesis tests, filters irrelevant ones statistically, and integrates seamlessly with sklearn. Learn installation, code examples, and real-world use cases.